
The Food Prices for Nutrition DataHub provides access to global statistics on the cost and affordability of healthy diets and related indicators. These data use food item availability and prices from the International Comparison Program (ICP), combined with food composition data and nutritional requirements from a wide range of sources including the Healthy Diet Basket based on national dietary guidelines.
The 42 indicators and their metadata cover:
Diet cost
- Cost of a healthy diet, per person per day
- Cost of an energy sufficient diet and a nutrient adequate diet, per person per day
- Cost per person per day, cost share, and cost relative to starchy staples of different food groups
Diet affordability
- Prevalence of unaffordability and number of people unable to afford each diet
- Ratio of each diet cost to observed national average food expenditures
- Ratio of each diet cost to the food component of the international poverty lines as defined by the World Bank's income group classification
For further information on definitions and methods please refer to Methodology.
[ Back to page top ]
DATA HIGHLIGHTS
- Global improvement, uneven progress: Access to healthy diets is improving worldwide, but large regional disparities remain.
- 2024 global cost: The average cost of a healthy diet reached $4.46 per person per day (PPP) in 2024.
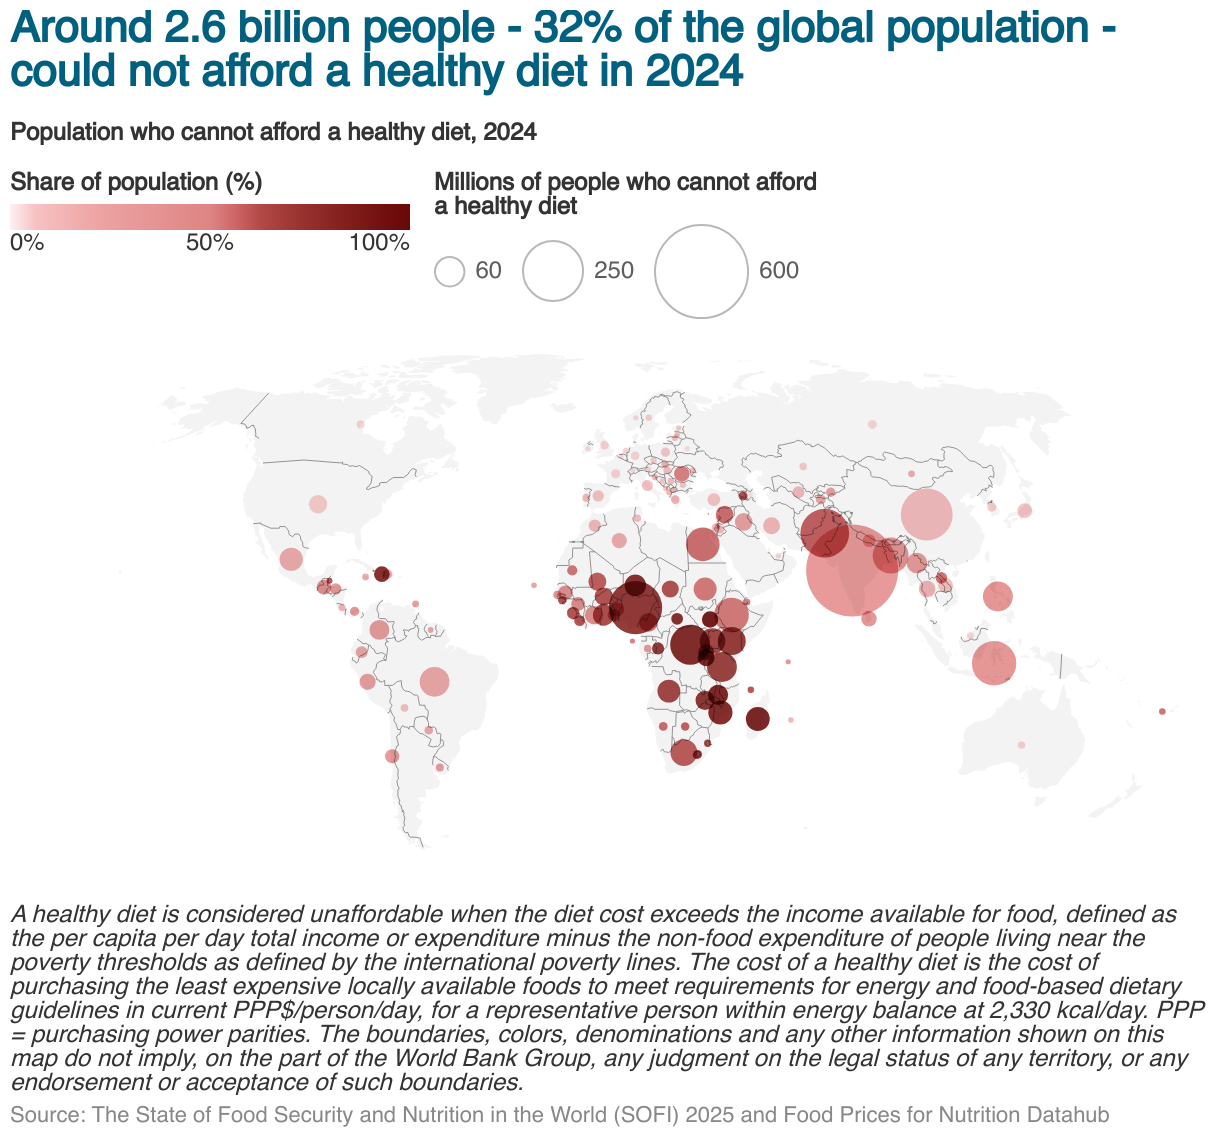
- Global affordability: Around 2.6 billion people could not afford a healthy diet in 2024, 48.8 million fewer than in 2023.
- Regional challenges:
- Sub-Saharan Africa and low-income countries faced two consecutive years of worsening affordability since 2022.
- Food inflation in these regions has eased only marginally, leaving diet costs near record highs.
- A somewhat worsening trend has also been observed in the Middle East and North Africa, Afghanistan and Pakistan region.
- The cost of each of the six food groups making up the cost of a healthy diet in 2021 is also provided.
- The most expensive food group is animal-sourced foods, priced on average at $1.00 for the daily quantity needed in a healthy diet. The highest cost is in low-income countries at $1.31 and in Sub-Saharan Africa at $1.22.
- Vegetables are the second most expensive at $0.76 globally, with Latin America & Caribbean having the highest cost of $1.02.
- Fruits cost $0.67 on average, and East Asia and Pacific has the highest cost of $0.95.
[ Back to page top ]
Cost of a healthy diet and the population unable to afford the diet in countries
The cost per person per day of a healthy diet in each country with data for the years 2017 to 2024 is plotted against the prevalence of unaffordability or the share of population who cannot afford the diet. Data on the number of people affected are also provided.
[ Back to page top ]
Food Prices for Nutrition was established to provide governments and development agencies with accurate and updated metrics to inform agricultural, food systems, social protection, and health and nutrition interventions.
Food Prices for Nutrition's outputs – indicators of the cost and affordability of diets and food groups and data for over 170 countries - use observed consumer prices and household expenditures to provide an operational measure of people’s access to locally available foods in the proportions needed for health.
The cost and affordability (CoAHD) indicators developed by Food Prices for Nutrition underlie the estimates published in United Nations' 2020 report The State of Food Security and Nutrition in the World (SOFI) that over 3 billion – or two in five people on the planet - could not afford a healthy diet in 2017. These data were used to frame the 2021 UN Food System Summit summary and statement of action. Ongoing global food inflation and supply shocks further underscore the need for timely data on the cost and affordability of healthy diets and nutritious food items and groups. The Food Prices for Nutrition Datahub, as the authoritative source for internationally standardized statistics, indicators, and granular data, meets this need for a global cohort of policy makers, development analysts, and other users.
Since 2022, in close collaboration with Food Prices for Nutrition global partners, the World Bank and the Food and Agriculture Organization (FAO) have led the methodological improvement for these indicators, and systematically monitor and disseminate the data series. The latest data and estimates reported in the SOFI 2025 report show that the total number of people unable to afford a healthy diet in 2024 was around about 2.6 billion, about one third of the global population. This is a reduction in the global prevalence of unnaffordability following the peak of the COVID-19 pandemic in 2020. However, the recovery has been uneven, with a worsening trend in low-income countries and the sub-Saharan African region.
Food Prices for Nutrition supports efforts within the framework of the Sustainable Development Goals (SDGs) to end hunger, achieve food security and improved nutrition, and promote sustainable agriculture by 2030 (SDG 2). It can also support the monitoring of progress towards the World Bank’s objective of building food systems that can feed everyone, everywhere, every day by promoting “nutrition-sensitive agriculture” and improving food safety.
[ Back to page top ]
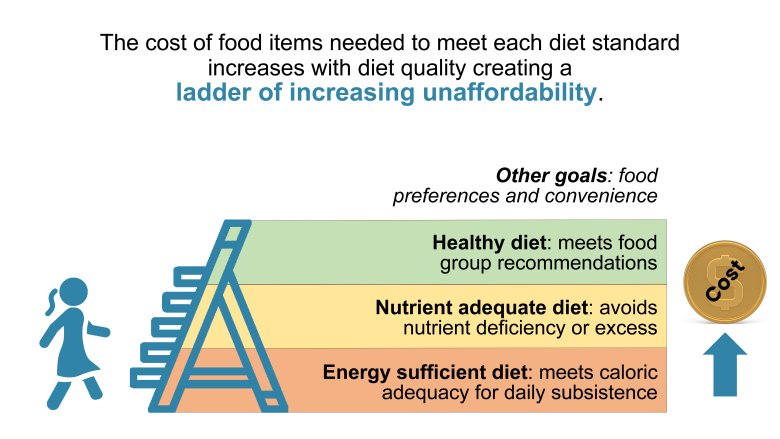
The Food Prices for Nutrition DataHub's diet cost and affordability indicators use the least cost combination of locally available foods to meet the needs of a representative adult requiring 2,330 kcal per day at three levels of diet quality: a healthy diet; a nutrient adequate diet; and an energy sufficient diet.
[ Back to page top ]
COST INDICATORS
- Cost of a Healthy Diet: A healthy diet meets nutritional standards set by dietary guidelines, with sufficient diversity and quantity within and between food groups to achieve nutrient adequacy and protect against diet-related diseases. To measure access and affordability, the cost of meeting food-based dietary guidelines is computed using the least expensive foods available in each category at each place and time (see "Methods and options to monitor the cost and affordability of a healthy diet globally", "Methods for monitoring the cost of a healthy diet based on price data from the International Comparison Program” and "Brief note: Methods and data sources" (Herforth et al. 2024). The cost of a healthy diet is the preferred indicator of diet costs as it uses the most affordable foods available at local markets to meet dietary needs for an active and healthy life, using standards adopted by national governments around the world. Total cost per day can be disaggregated by food group, showing the cost per day of the least expensive locally available items in each food group (fruits; vegetables; starchy staples; animal-source foods; legumes, nuts, and seeds; and oils and fats)
- Cost of a Nutrient Adequate Diet: A nutrient adequate diet meets all essential nutrient requirements, with sufficient diversity and quantity of locally available foods to stay within the upper and lower bounds for total protein, fats, and carbohydrates as well as essential vitamins and minerals required to avoid nutrient deficiencies or toxicity. Computation of the least-cost nutrient adequate diet requires linear programming optimization modeling, and is based on nutrient requirements only, rather than food groups specified in dietary guidelines.
- Cost of an Energy Sufficient Diet: An energy sufficient diet provides enough of a starchy staple food for day-to-day subsistence, without either nutrient adequacy or adherence to dietary guidelines. The least-cost version of this subsistence diet uses the most affordable locally available starchy staple, achieving energy balance but not nutrient adequacy or other dietary needs.
For each of the diets listed above, costs per day are based on requirements for a median adult woman aged 19-30 in a healthy population as defined by the World Health Organization. For the Cost of a Nutrient Adequate Diet and the Cost an Energy Sufficient Diet, please refer to the Food Policy article “Cost and affordability of nutritious diets at retail prices: Evidence from 177 countries” (Bai et al. 2021). Information on the variation in the cost of nutrient adequacy by age, sex and reproductive status can be found in the Lancet article "Global variation in the cost of a nutrient-adequate diet by population group: an observational study" (Bai, Herforth and Masters 2022).
[ Back to page top ]
AFFORDABILITY INDICATORS
The affordability of each diet is measured by comparing diet costs to available income and four affordability metrics for each level of diet quality are calculated. According to an updated method applied in 2024, the first three indicators rely on the food expenditure share and basic non-food expenditure share of low-income consumers by countries’ income group classification, based on recent household survey data compiled by the World Bank. This updated method was also used for The State of Food Security and Nutrition in the World (SOFI) 2024 report. The fourth metric uses actual food expenditure. The metrics available are:
- The prevalence of unaffordability (PUA) of each level of diet quality, using household income or expenditure data for each country from the World Bank’s Poverty and Inequality Platform.
- The number of people unable to afford (NUA) each level of diet quality, using the prevalence of unaffordability multiplied by the total population in each country.
- The ratio of a country’s diet cost to the food component of the international poverty line, with the food component defined as the food expenditure share of low-income consumers multiplied by international poverty lines by countries’ income group classification.
- The ratio of a country’s diet costs to observed food expenditures per capita per day from national accounts, as reported by the International Comparison Program.
[ Back to page top ]
- September 15, 2025: Cost and Affordability of Healthy Diets: Adoption and Use of a New Food Security Metric, Asian Development Bank (ADB)
- Presentation: William Masters, Professor, Food and Nutrition Economics, Policy and Programs, Tufts University
- Discussant: Albert Park, Chief Economist, Economic Research and Development Impact Department, ADB
- July 25, 2025: Annual Bank Conference on Development Economics 2025 session on "Agricultural Markets and Nutrition"
- William Masters on Poverty Measurement and the Cost of Healthy Diets [ paper ]
- October 28-30, 2024: Food Prices for Nutrition Stakeholder Convening on “Monitoring the Cost and Affordability of a Healthy Diet Within Countries and Globally”, Rome, Italy.
- Workshop Briefing Page - Monitoring Healthy Diet Workshop
- May 18, 2023: 9th Intl. Conference on Agricultural Statistics session on "Access to healthy diets"
- Nada Hamadeh, chair – opening remarks (pdf)
- Anna Herforth on measuring access as the cost & affordability of healthy diets [abstract (pdf), slides (pdf)]
- Kalyani Raghunathan on the cost & affordability of healthy diets in India [abstract (pdf), slides (pdf)]
- Rachel Gilbert on role of trade and import barriers in retail diet costs [abstract (pdf), slides (pdf)]
- Yan Bai on measuring diet costs with national data instead of prices reported to the ICP [slides (pdf)]
- Discussants: Prince Adeyemi Adeniran (Nigeria), Bernice Serwah Ofosu-Baadu (Ghana)
- April 6, 2023: SocialProtection.org webinar "Addressing the Global Food, Energy and Cost of Living Crises: The role of social protection in strengthening food systems’ resilience" [slides (pdf), video]
- February 13, 2023 (12.00-18.30 CET) GDPRD/ RU/ IFAD/ GPSDD consultation event "Assessing the Data ‘Quantum’ Leap in Agriculture and Food Systems: Consultations for New Strategic Directions" [Presentation (pdf)]
- July 15, 2022 (10:00-11:30 am ET) IFPRI policy seminar "Are healthy diets affordable? Using new data on retail prices and diet costs to guide agricultural and food policy"
- July 14, 2022 (10:00-11:30 am ET) World Bank Live event "Are healthy diets affordable? Using new data to guide agricultural and food policy" [Presentation (pdf)]
- July 6, 2022 (10:00-12:00 ET) UN (FAO, IFAD, UNICEF, WFP and WHO) launch event "State of Food Security in the World 2022"
Videos
- Tufts-FAO webinar on true cost and affordability of healthy diets (25 min.)
- Harvard Chan School of Public Health nutrition seminar: Retail food prices and the affordability of healthy diets worldwide (50 min.)
- Friedman School of Nutrition microcourse: Beyond calories: cost & affordability of healthy and sustainable diets (23 min.)
[ Back to page top ]
Papers, Blogs and Articles
- Herforth, A.W., Bai, Y., Venkat, A. et al. The Healthy Diet Basket is a valid global standard that highlights lack of access to healthy and sustainable diets. Nat Food (2025).
- Wallingford, J.K., S. de Pee, A.W. Herforth, S. Kuri, Y. Bai, R.D. Gilbert and W.A. Masters (2024), Using food prices to calculate least-cost healthy and nutrient adequate diets helps inform social protection efforts worldwide, Policy in Focus, Vol. 1, No. 1: 52-55. Brasília: World Food Programme (WFP) and the Institute for Applied Economic Research, Government of Brazil.
- Roser M. (2024) We Need a New Global Measure for Poverty. The New York Times
- Moncayo, J., Bai, Y., Cafiero, C., Conti, V., Herforth, A., Masters, W., and Rissanen, M. (2024) Uneven recovery post-COVID: healthy diets remain out of reach for many in lower- income countries, July 24, 2024
- Bai, Y., Conti, V., Ebel, A., Cafiero, C., Herforth, A., Rissanen, M.O., Rosero Moncayo, J. & Masters, W.A. (2024). Methods for monitoring the cost of a healthy diet based on price data from the International Comparison Program. FAO Statistics Division Working Paper. Rome, FAO.
- Bai, Y., Herforth, A., Cafiero, C., Conti, V., Rissanen, M.O., Masters, W.A. & Rosero Moncayo, J. (2024). Methods for monitoring the affordability of a healthy diet. FAO Statistics Division Working Paper. Rome, FAO.
- Wallingford, J. K., de Pee, S., Herforth, A. W., Kuri, S., Bai, Y., & Masters, W. A. (2024). Measuring food access using least-cost diets: Results for global monitoring and targeting of interventions to improve food security, nutrition and health. Global Food Security, 41, 100771.
- Gilbert, R., L. Costlow, J. Matteson, J. Rauschendorfer, E. Krivonos, S.A. Block and W.A. Masters (2024). Trade policy reform, retail food prices and access to healthy diets worldwide. World Development, 177: p.106535.
- Wallingford, J., E.M.Martinez and W.A. Masters (2023), COVID-19 mobility restrictions and stay-at-home behaviour in 2020 were associated with higher retail food prices worldwide. Global Food Security e100702. [replication file]
- Food Prices for Nutrition 2023 Highlights (Annual progress report)
- Bai Y., J. Bouscarat, K. Sokourenko, P. Heinrigs, and K. Zougbédé (2023) Healthy diets, costs and food policies in the Sahel and West Africa, 31 July 2023. Also available in French.
- Purdie E., Y. Bai, I. Song, and R. Costa (2023) How much does a healthy diet cost in your country? And is it affordable? Introducing a new Food Prices for Nutrition online course, July 24, 2023.
- Rosero Moncayo J., N. Hamadeh, M. Rissanen, V. Conti, and Y. Bai (2023) Over 3.1 billion people could not afford a healthy diet in 2021 - an increase of 134 million since the start of COVID-19, July 17, 2023.
- Bai Y., E. Purdie, M. Nsabimana, and M. Rissanen (2023) Diet affordability indicators incorporate the latest poverty and inequality data to monitor access to a healthy diet, May 15, 2023.
- Masters, W.A., E.M. Martinez, F. Greb, A. Herforth and S.L. Hendriks (2023). Cost and affordability of preparing a basic meal around the world, in J. von Braun et al., eds, Science and Innovations for Food Systems Transformation, pages 603-623, January, 2 2023.
- Masters, W.A. and A. Herforth (2021). Three billion people cannot afford a healthy diet. The Conversation, July 9, 2021.
- Bai, Y. and W.A. Masters (2020), Retail food prices at purchasing power parity exchange rates. World Bank data blog, May 26, 2020.
- Herforth, A. (2020). Three Billion People Cannot Afford Healthy Diets. What Does This Mean for the Next Green Revolution? CSIS, Washington, September 23, 2020.
- Masters, W.A., Y. Bai, K. Hirvonen and D. Headey (2019), Can the world’s poor afford a healthy diet? VoxDev column, December 13, 2019.
- Peinhardt, K. (2019), Are nutritious diets becoming more accessible? IFPRI blog post, June 6, 2019.
[ Back to page top ]
Media
- February 2024: Pakistani news coverage of Food Systems Dashboard conference featuring FPN project work on CoAHD in Lead Pakistan, The Neutral, Trade Chronicle, The Nation, The News
- January 2024: Nigerian news coverage of CoHD bulletin and press release in Vanguard, Agoro Policy, BBC. ThisDay, The Guardian
- June 2022: Washington Post article on the true cost of food
- June 2022: The Independent (UK) + Tufts Now on world food prices
- May 2022: Johns Hopkins podcast on the global food price crisis
- February 2022: Yumlish podcast on food prices and cost of healthy eating
- November 2021: Le Monde article on food prices (in French) [ ungated pdf ]
- March 2021: Eat This podcast on diet costs and affordability
- February 2021: Tufts Now article on food prices and diet costs
- December 2020: Nature Outlook article on diet costs & affordability
[ Back to page top ]
Events
- October 16-20, 2023: Micronutrient Forum 6th global conference (including Rachel Gilbert in a session on food environments & diet quality and diet affordability, and Kay Dewey (with Y. Bai & W.A. Masters) poster on cost of infant feeding (abstract))
- August 14-15, 2023: U.S. National Academies Food Forum workshop on diet and disease (including presentation on Food choice and access to healthy diets: Evidence from food prices and diet costs worldwide
- February 13, 2023: GDPRD/ EU/ IFAD/ GPSDD consultation event on Assessing the Data ‘Quantum’ Leap in Agriculture and Food Systems
- December 7, 2022: GAIN symposium on food affordability
- September 26, 2022: AAEA online symposium
- July 31- Aug 2, 2022: AAEA annual meeting presentations
- July 15, 2022: IFPRI policy seminar online
- July 14, 2022: World Bank Live event online
- July 6, 2022: SOFI 2022 launch at UN headquarters
[ Back to page top ]
Reports and Papers (Selected)
| Source | Title | Date |
| Nature Food | The Healthy Diet Basket is a valid global standard that highlights lack of access to healthy and sustainable diets | 5/27/2025 |
| Agricultural Economics | Measuring Food Access as Affordability of Least-Cost Healthy Diets Worldwide | 4/23/2025 |
| Food Policy | Global poverty and the cost of a healthy diet | 4/15/2025 |
| Journal of Development Economics | On the properties of the two main types of global poverty lines | 3/15/2025 |
Media and Blogs (Selected)
Data access
-
DataBank
Download Food Prices for Nutrition data from the World Bank’s DataBank -
Data Catalog
Access Food Prices for Nutrition API, metadata, and documentation from the World Bank’s public Data Catalog -
Data360
Explore CoAHD indicators on the World Bank’s newly launched interactive Data360 platform.


online learning

Featured
-
Blog
Can everyone afford to eat healthy? New data show progress, but not everywhere
The latest blog highlights global progress, while some countries are falling further behind. -
Publication
July 2025 SOFI report
The State of Food Security and Nutrition in the World (SOFI) 2025 was published on July 28, 2025, and featured updated cost and affordability of a healthy diet data. -
Blog/Paper
Beyond calories: Benchmarking access to healthy diets for people, planet, and policy
A new blog highlights recent analysis from Nature Food that compares standards for the Healthy Diet Basket. -
Paper
Methods for monitoring the affordability of a healthy diet
This 2024 study updates the methods for monitoring the affordability of a healthy diet. -
Workshop Summary
Monitoring Healthy Diets (CoAHD)
The workshop brought together global and national stakeholders in monitoring processes for the Cost and Affordability of a Healthy Diet (CoAHD).


NEWS AND CONVERSATION
Contact us at FPN@worldbank.org, and follow #FoodPricesForNutrition on Twitter and LinkedIn