Q: What can high resolution satellite imagery reveal about economic welfare? Can the use of such images help compensate for data gaps?
A: Despite the best efforts of national statistics offices and the international development community, local estimates of poverty and economic welfare remain infrequent. Partly, this reflects the fact that census data are collected infrequently – typically once every ten years. In some other countries, household survey data measuring economic welfare is collected once every five or ten years.
Satellite imagery has generated considerable enthusiasm as a potential supplement to household data that can help fill these severe gaps. There are two ways one can use satellite imagery for this. One is to look for ‘object features’ in the images such as the number and size of buildings, type of farmland (plantation vs. orchard), as the number of cars the type of roofs, the prevalence of shadows, roads, and road material, along with textural measures of the type mentioned above. Texture and spectral features can also computed directly from the imagery. A second approach is to train computers to predict poverty directly, using the same technology that computers use to recognize faces or other objects. Since direct poverty prediction is not always accurate, ongoing research is still trying to better understand the relative merits and requirements of each approach.
In our study, both object and texture features were matched to household estimates of per capita consumptions imputed into the 2011 census (the same ones used by the DCS to generate DS Division estimates of poverty), for 1,251 GN Divisions. The satellite features track poverty rates closely, as they explain around two thirds of the variation in welfare. This suggests that features extracted from high-resolution imagery could be paired with household survey data to generating more frequent poverty maps. We plan to explore opportunities to partner with the DCS to apply this new technology to update the DS Division poverty estimates when the 2016 household income and expenditure survey becomes available.
Q: How are ‘poverty maps’ used by policy makers and various ministries?
A: The poverty maps of Sri Lanka have had a wide impact. Perhaps one of the most important impacts was the use of the maps by the Ministry of Samurdhi to select 113 of the poorest Divisional Secretariats (DSs) when the ministry initiated the reform of the Samurdhi transfer program for the poor.
This did not happen in isolation; it was an outcome of the tireless efforts of the DCS to disseminate the results of the poverty mapping exercise to the public and, especially, government officials. Now, many officials are aware of poverty maps as important instruments for identifying and targeting poor areas.
The Sri Lanka poverty maps are accepted widely because the DCS has taken this lead in dissemination. DCS staff are able to explain the technical aspects of poverty maps and deal with the political sensitivity of the maps. The World Bank’s long-term commitment to capacity building within the DCS, which began well before the poverty mapping exercise, and our role in their dissemination have also contributed to this success.
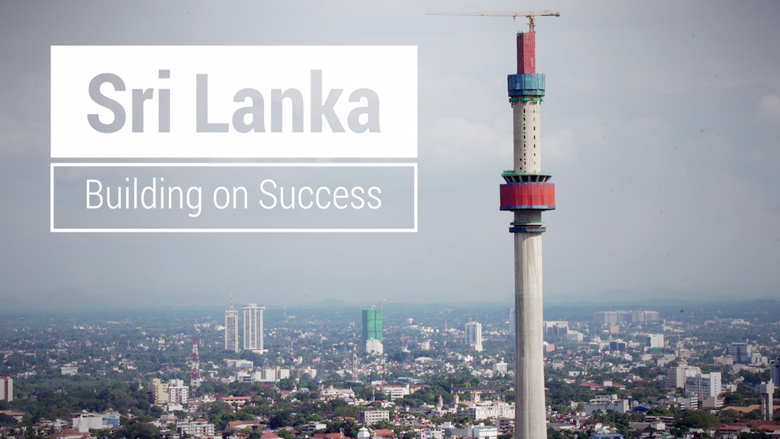
Q: What can be done to build on Sri Lanka’s successes in poverty alleviation?
A: Some of Sri Lanka’s success can be attributed simply to rising international prices for food and tea that raised earnings in agriculture, and strong domestic aggregate demand that boosted economic growth. However, these factors cannot be relied upon to continue in the future, and it is rapid structural transformation and increased agglomeration that has the most potential to sustain poverty reduction in the future.
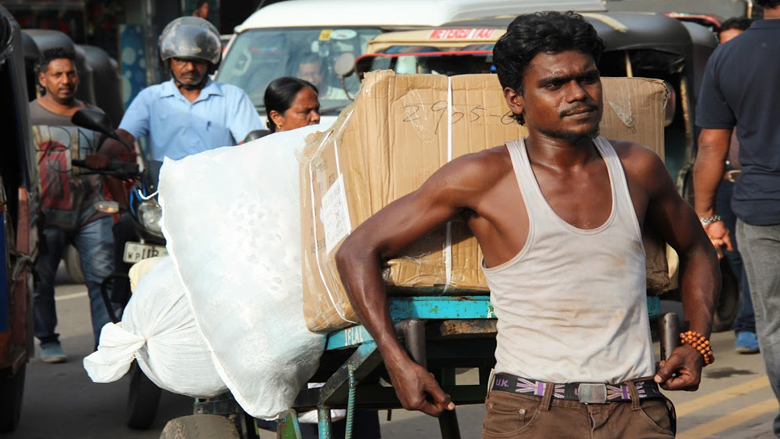
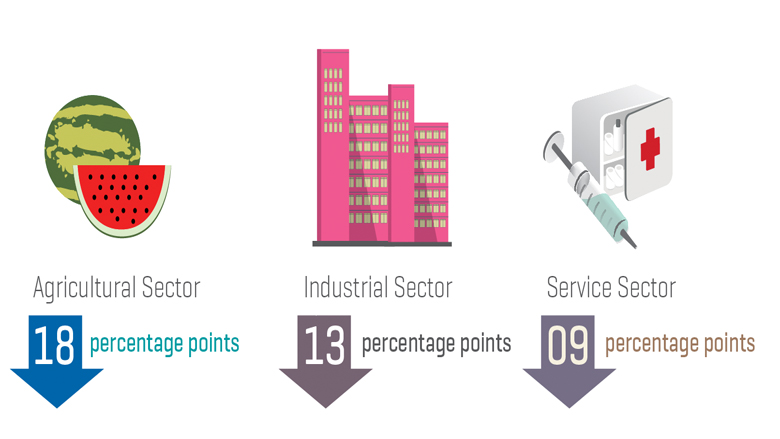
Efforts to further improve living standards of the poor should focus on promoting further structural transformation and urbanization. Roughly 28 percent of the workforce, and about half of the working poor, toil in the agriculture sector. Many of the poor live in peri-urban areas – over half of the poor are estimated to live within 30 km of a main agglomeration area. Policies that help connect these workers to productive employment opportunities off the farm can contribute to sustainable poverty reduction. This is a long term agenda, however, and it will take years if not decades to reduce agricultural employment below 10 percent.
In the meantime, poor farmers and agricultural labourers need help to generate the income to allow them to invest in the human capital of their children. Some of these farmers were hit hard by bans on slash and burn agriculture. This was necessary to protect the environment and regulate land use, but in some cases limited agriculture to one growing season per year. Farmers and agricultural labourers could benefit greatly from practical infrastructure investments, such as water storage tanks, irrigation facilities, fertilizer and seeds, electricity, and roads that would make them more productive. In addition, microfinance programs that offer loans at reasonable interest rates that can be repaid post-harvest, rather than every month, could also facilitate productive investment among smallholder farmers.
Although 95 percent of the population can now access electricity, more cost-effective power generation will be required to support further productivity growth. Effective governance of cities will also be important to enhance the ability of workers to take advantage of more productive job opportunities in and around urban areas.
Sri Lanka also has an admirable history of strong social assistance programs which are well-worth continued investment. These along with multisectoral interventions targeted to the remaining pockets of poverty, can help support the existing poor. However, we also need to think long term. Like many other countries Sri Lanka needs to prepare for the challenges of an aging population and a growing middle-class.