To understand poverty in Sri Lanka requires that we take into account both the successes and the challenges that remain. It also asks that we innovate, using tools—from high resolution satellite images to poverty maps—to create the in-depth analysis that can inform policy and spark conversations on how this vibrant island-nation can overcome poverty.
In this two-part Q&A, David Newhouse, a senior economist with the World Bank, takes questions on how poverty is measured and why Sri Lanka needs to update its current poverty line. He also identifies key areas of concern, in particular how the unequal spatial distribution of wealth has seen communities left behind in certain parts of the island. He concludes by offering insights from the research that could help Sri Lanka build on its considerable successes.
Q: How is poverty measured in Sri Lanka?
A: In Sri Lanka, poverty figures refer to the share of individuals whose household per capita consumption falls below the official poverty line. This poverty headcount index is the standard measure of the incidence of poverty.
The headcount index is calculated by taking into account all the food and non-food expenditures collected in the Household Income and Expenditure Survey (HIES). Differences in the cost of living across different districts, and the number of people in the household are also considered.
This per capita household consumption is then compared to the national poverty line. This line was defined as the expenditure for a person to meet the daily calorie intake of 2,030 kcal based on the Cost of Basic Needs approach, and was set at Rs 1,423 in 2002. To keep the national poverty line constant, this line has been inflated in subsequent years using the Colombo Consumer Price Index (CCPI).
Sri Lanka’s current poverty line is moderate by regional standards, but below what one might expect from a country at Sri Lanka’s level of development. This is partly because the poverty line was developed using 2002 data and is therefore based on consumption patterns in 2002. The country’s context has changed dramatically in the years in between, and we believe it is good practice to update the benchmark used to judge poverty about once per decade. This makes updating the current poverty line a priority for Sri Lanka.
Q: What is the absolute international poverty line and how does Sri Lanka compare with other countries in the region?
A: The World Bank begins measuring global poverty by setting what is known as an absolute international poverty line. The first step is to create a benchmark that is consistent across all countries, using purchasing power parity (PPP) exchange rates. PPP exchange rates are used instead of market exchange rates because they reflect differences in the price of food and other non-tradeable goods, while market exchange rates only apply to goods that are traded internationally.
Between 2008 and 2015 the absolute international poverty line was set at $1.25/day in 2005 dollars. However, in 2015 the World Bank updated this from $1.25 to $1.90 per day, in 2011 dollars, to reflect the changes in the estimated purchasing power of the dollar in poor countries between 2011 and 2005. In both cases, the line was set based on the national poverty lines of 15 very low-income countries, converted to US$ using purchasing power parity exchange rates (more details can be found here)
Sri Lanka has among the lowest extreme poverty rates among countries in the region, as 1.8 percent of the population were estimated to be extremely poor in 2013. However, living standards remain low, as nearly 45 percent of the population lived on less than $5 per day in 2013.
Q: How has Sri Lanka fared in its poverty alleviation efforts in the post-war context?
A: Sri Lanka’s efforts in reducing poverty have been praiseworthy.
Excluding the Northern and Eastern provinces, headcount poverty fell from 22.7 percent to 6.1 percent between 2002 and 2012/13. In that same period, extreme poverty in Sri Lanka decreased from 13 percent to less than 3 percent in 2012/13— lower than many of Sri Lanka’s neighbors, other post-conflict countries, and other comparable countries.
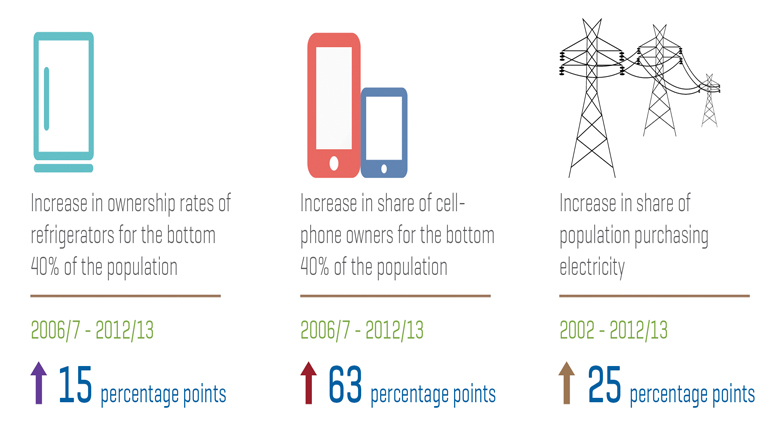
This increased welfare is reflected in higher ownership rates of durable assets among poorer households. For instance, between 2006/7 and 2012/13, ownership rates of refrigerator, motorcycle, washing machine, computer, and telephone more than doubled among the bottom 40 percent. One of the most dramatic shifts occurred in cell phone ownerships, as the share of the bottom 40 percent that owned a mobile device rose from 13 to 76 percent.
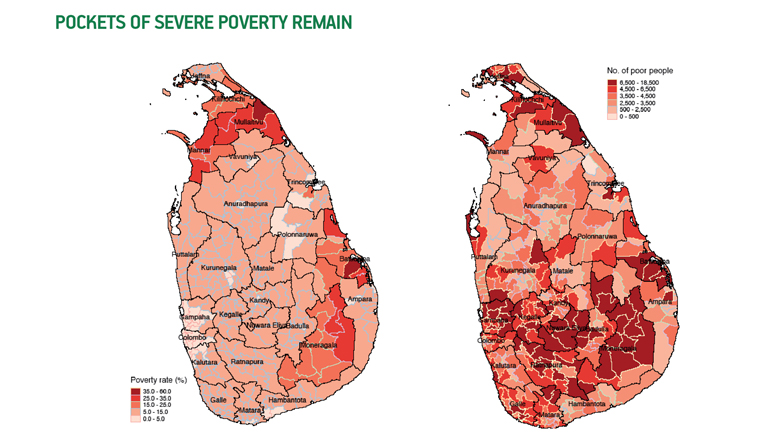
However, spatial variations in the distribution of poverty represent a challenge.