The World Bank's Global Gas Flaring Tracker is the only global and independent indicator of gas flaring. The estimates allow us to monitor global flaring levels and assist in tracking progress toward Zero Routine Flaring by 2030. You can view the lastest Global Gas Flaring Tracker (June, 2026) here and each of GFMR's interactive visualizations below:
Global Flaring and Methane Reduction Partnership (GFMR)
Global Gas Flaring Data
Gas Flaring Volume and Oil Production Charts
Our estimates, derived from satellite data, show that 167 billion cubic meters (bcm) of associated gas was flared at upstream oil and gas facilities and LNG liquefaction plants in 2025.
Flaring Indicators by Economy
Satellite data estimates show that the top 9 largest flaring countries in 2024 were Russia, Iran, Iraq, Venezuela, Mexico, Libya, Algeria, Nigeria, and the United States. These countries accounted for 83% of all gas flared, but less than half of global oil production.
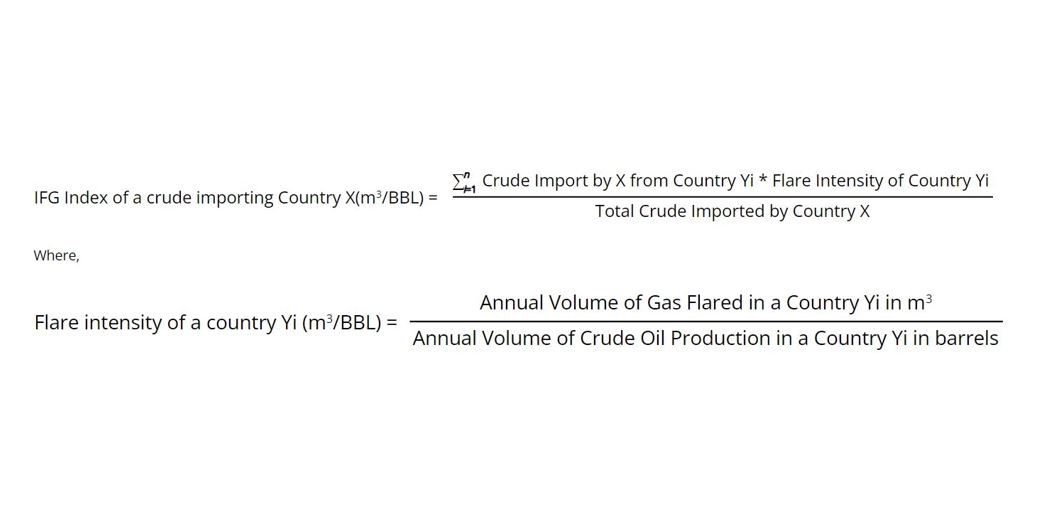
Imported Flare Gas Index
The Imported Flare Gas (IFG) Index shows how countries importing crude oil are exposed to gas flaring, since they import crude oil from countries that flare large volumes of associated gas. The IFG Index underscores the need for oil-importing countries to play an influential role in reducing gas flaring.
About our Global Flaring Data
The Global Gas Flaring Tracker Report is produced on an annual basis by the World Bank’s Global Flaring and Methane Reduction (GFMR) Partnership, comprising governments, oil companies, and international institutions working to end routine gas flaring at oil production sites around the world. GFMR, in partnership with the US National Oceanic and Atmospheric Administration (NOAA) and the Payne Institute for Public Policy at the Colorado School of Mines, has developed global gas flaring estimates based upon observations from satellites launched in 2012 and 2017. The advanced sensors of these satellites detect the heat emitted by gas flares as infrared emissions at global upstream oil and gas facilities.
The Colorado School of Mines and GFMR currently quantify these infrared emissions and calibrate them using country-level data collected by a third-party data supplier, Cedigaz, to produce estimates of global gas flaring volumes. The satellite data for estimating flare gas volumes are collected by NOAA’s satellite-mounted Visual and Infrared Radiometer Suite of detectors (VIIRS).
VIIRS has a multispectral set of infrared detectors which:
- At nighttime responds only to heat emissions and hence are not affected by moonlight, or other light sources;
- Respond to wavelengths where emissions from flares are at a maximum; and
- Have excellent spatial resolution.
The ability of VIIRS to detect and discriminate hot sources, such as gas flares, enables flares to be detected automatically with minimal manual intervention. Emissions from non-flare hot sources (e.g., biomass burning) can be removed from the data by selecting only emissions with temperatures above 1,100°C; other hot sources burn at lower temperatures. Indeed, flares burn hotter than any other terrestrial hot sources, including volcanoes. Since the first year of operation in 2012, VIIRS satellites have automatically detected ~10,000 flares annually around the globe.
Annex I countries are defined by The United Nations Framework Convention on Climate Change (UNFCCC) and includes the industrialized countries that were members of the OECD (Organisation for Economic Co-operation and Development) in 1992, plus countries with economies in transition (the EIT Parties), including the Russian Federation, the Baltic States, and several Central and Eastern European States. UNFCCC identified the common but differentiated responsibilities and respective capabilities of different parties under Kyoto Protocol where Annex I countries committed to absolute emission reduction or limitation targets, whereas all other (non-Annex I) countries had no such obligations.
A note on methodology: The IFG Index aims to quantify the concept that if, a country is importing crude from producing countries then it is also importing the flaring intensity of these producing countries in proportion to the amount of crude oil imported. The methodology to calculate IFG index may be described by following formula(s).
Disclaimer: GFMR uses data from satellites operated by the U.S. National Oceanic and Atmospheric Administration (NOAA) that scan the globe each day, interpreted with the assistance of The Payne Institute for Public Policy at the Colorado School of Mines, to identify flaring sites and estimate flare volumes. To identify the location of the flaring, the flare data has been combined with metadata, obtained from several sources. Although the metadata is updated on a regular basis, changes may have taken place since the last update. If you believe a flaring field is misidentified, please contact us with the corrected data. GFMR has made every reasonable effort to ensure the data used and displayed has been obtained from reputable and reliable sources. GFMR and the World Bank are not responsible for any errors, omissions, or for the results obtained from the use of this information.
Data Sources:
- Flare gas volumes: NOAA, The Payne Institute for Public Policy, the Colorado School of Mines, GFMR
- Oil production: EIA (Crude oil including lease condensate only)
- Crude Oil Imports by Country: UN Comtrade database
Global Flaring Data Resources


Contact us
For more information about GFMR, to join the partnership, or discuss collaborating on flaring and methane reduction opportunities, please contact us.
GFMR Gas Flaring Definitions
-
PDFThis document groups the various types of gas flaring at oil production facilities in three defined categories: routine flaring, safety flaring, and non-routine flaring.Download

Methodology for Determining Flare Volumes from Satellite Data
-
PDFGFMR, in partnership with NOAA and the Colorado School of Mines, has developed global gas flaring estimates based upon observations from a satellite launched in 2012.Download

-
 Dec 07, 2015
A Personal Appeal to End Routine Gas Flaring
For Faith Nwadishi and her community in Nigeria, gas flaring negatively impacts their fundamental way of life. She tells us why this oil and gas industry practice must end as soon as possible. #EndRoutineFlaring
