Nepal: Mapping for Results

May 9, 2013

Image

In 2011, Mapping for Results mapped the location of 23 projects at the village development committee level. Visualization of project locations is a powerful tool to respond better to the demands of a population living in a challenging geographic and political environment. Project teams and partners are starting to use maps for their own project targeting, monitoring, and to create synergies among partners.

Challenge

Project management teams input information about the location of project activities in their own databases, and use this information to make strategic decisions and report results. However, in a country with a large number of community investments and a diversity of needs, as is the case of Nepal, investments from different sectors are spread throughout the country. Monitoring a vast portfolio of investments and communicating results that target specific social groups and areas was a difficult task.  Each project maintains a separate database, making it difficult to identify gaps and potential synergies between projects and partners.

Solution

The Mapping for Results initiative builds capacity in implementing agencies to record location information on investments in a standard way, making it easier to combine datasets from different sectors, units, or agencies. Visualizing this information on an interactive map available on the Internet makes communication of results more transparent. A map enables viewers to see opportunities for promoting linkages between different projects and across sectors.

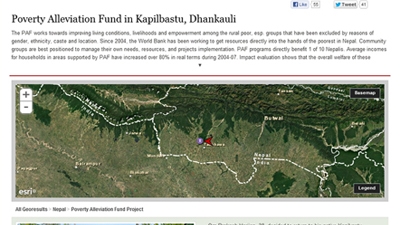
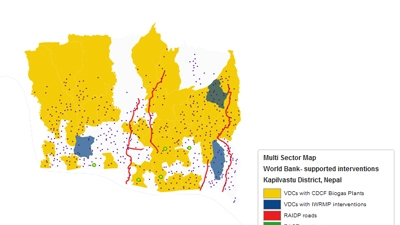
For example, in the district of Kapilvastu, which is located in the western development region of Nepal, the World Bank (WB) is financing different interventions: investment in irrigation schemes through the Irrigation and Water Resource Management Project (IWRMP); the construction and rehabilitation of rural roads through the Rural Access Improvement and Decentralization Project (RAIDP); five grants for agricultural export diversification activities financed by the project for Agriculture Commercialization and Trade (PACT); community investments from the Poverty Alleviation Fund (PAF); and biogas plants implemented by the Community Development Carbon Finance Project (Biogas CDCF).
Image

Figure 1: Map of WB interventions in Kapilvastu  District

See interactive version @ https://tiles.mapbox.com/mirella/map/Kapilvastu2


Having this visual information enables the different task teams and project managers to see that it may be possible for the agriculture diversification activities to have applications at the irrigation schemes or with the mobilized communities. Investments in energy through the biogas plants can benefit processed food activities, and livestock community investments could benefit the generation of cleaner energy through the biogas carbon project. In reality, project teams can look at the maps when making field visits, combine efforts to use the framework already formed by other projects, complement activities and even join field visits to identify opportunities for collaboration on the ground.

Result

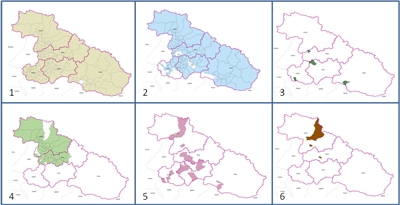
The results of the Mapping for Results initiative varies across sectors and units. Some project teams have been using visualization tools at the management level, making project management more efficient in the way teams monitor results on the ground. One of the most striking examples is the use of visual tools to support the Nepal Food Crisis Response Program. Figure 2 shows a map of the Karnali region, the most food-insecure region in Nepal. The map has been used to address coordination between projects and identify the absence of interventions in certain areas where vulnerable populations live, to promote discussions, and to encourage the implementation of more appropriate strategies. An image of these interventions has allowed policy makers to identify gaps in the area that can be filled by other resources and development partners.


Image

Figure 2: Map of Community-Targeted Interventions Addressing Food Insecurity in Nepal

1. Karnali region, 100 percent covered by the Poverty Alleviation Fund

2. Location of public works developed through the Social Safety Nets Project

3. Location of irrigation schemes implemented by the Irrigation and Water Resources Management Project

4. Location of areas covered by fertilizer distribution financed by the Social Safety Nets Project

5. Location of water and sanitation schemes financed by the Rural Water Supply and Sanitation Project

6. Location of breeder seed production centers financed by the Social Safety Nets project

See interactive version @  https://tiles.mapbox.com/mirella/map/PAF_Poverty


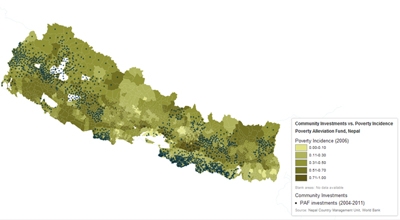
Another example is the use of socio-economic indicators to show progress or improve targeting of the projects. For example, the mandate of the Poverty Alleviation Fund (PAF) is to reach the poorest communities and the most vulnerable and excluded people within those poor communities. To see if PAF targeting is working effectively, a poverty incidence map (from the Nepal Living Standards Survey six years ago) was compared with the locations where PAF activities have been supported (recognizing that PAF is not yet operational nationally). This map shows darker green for areas with higher incidence of poverty and blue dots for the location of PAF activities.


Image

Figure 3: Community Investments vs. Poverty Incidence – Poverty Alleviation Fund


Link to MDGs

Eradicate extreme poverty and hunger
Develop a global partnership for development

Bank Group Contribution

As Mapping for Results was requested by the Nepal Country Director, the initial cost of this initiative was supported by the Country Management Unit (CMU) and the World Bank Institute. The cost of the initiative is calculated at US$100,000 for one year. Project teams have also contributed to their own mapping initiatives and teams have covered the cost of gathering more detailed information, even at the community level.

Partners

This activity required building a strong partnership with government organizations. Government agencies dealing with spatial information, including the Survey Department and the National Planning Commission provided an official list of administrative levels and spatial geographic data. Project implementation units provided on the ground information, and worked together with the mapping team to adapt their databases and make their information readily available and public.

Moving Forward

The Mapping for Results initiative in Nepal responds to the World Bank's new Access to Information Policy launched in 2010. The Nepal Country Team supports this policy through continuing to support the Mapping to promote transparency and accountability of World Bank interventions in the country. After one year, a foundation to continue this support is in place: a common platform has been created and manuals are ready.

Moving forward, the Mapping initiative is being extended to a multi-modal approach to collect feedback from citizens (that is, Short Message Service, Mobile and Web) and grievance handling; the first pilot is planned for fiscal year 2013 and will be tested in the Kapilavastu district as part of the Nepal PAF project.

In addition, the Bank is working with other donors in Nepal to extend the Mapping methodology and tools to create a common Map under the Open Aid Partnership multi-donor trust fund facility.

Beneficiaries

As a first stage, direct beneficiaries include project implementation units in Nepal. This platform allows teams to target the projects better and communicate the results to civil society organizations when establishing third party monitoring activities.


Welcome