Access to safe and clean water and sanitation are internationally recognized human rights as they have great implications on the state of public health and economic growth in a country.
Nationally, there was a marked positive shift in access to improved sanitation facilities in Tanzania.
Further, access to clean drinking water has improved in Tanzania between 2014/15 and 2020/21. Specifically:
Half of the population in Tanzania now has access to clean drinking water during the rainy season.
Two-thirds of the population has access to clean drinking water during the dry season.
Access to water in urban areas is consistently better than rural ones.
Energy sources
Electricity and clean cooking fuels are the energy sources which are key drivers in the transformation of nations and development initiatives such as the Tanzania Rural Electrification Project. The goal of such project is to improve the availability and accessibility of energy in ths country. Results from the NPS shows that:
More than one-third of households in Tanzania used electricity as their main source of energy for lighting in 2020/21, showing a visible trend of increase over the years.
While rural areas still face barriers, the proportion of rural households using electricity significantly improved in the past 15 years.
Education
Education is a key determinant of progress across developing countries as it has direct or indirect link with development indicators. The NPS unfolds data of two main aspects of education: literacy rate and school enrollment rate:
1. Literacy rate of school going children between 7 - 13 years of age
Theliteracy rate of school-going children between 7 - 13 years of age has improved across the country. The figure below shows significant improvements in each geographic location of Tanzania since 2010/11:
2. Enrollment rate
In general, the net enrolment rate in primary school for 7-13-year-olds has improved in all areas of the country across both genders.
While rural areas are below the national average, there was still some improvement across all levels of enrollment between 2014/15 and 2020/21:
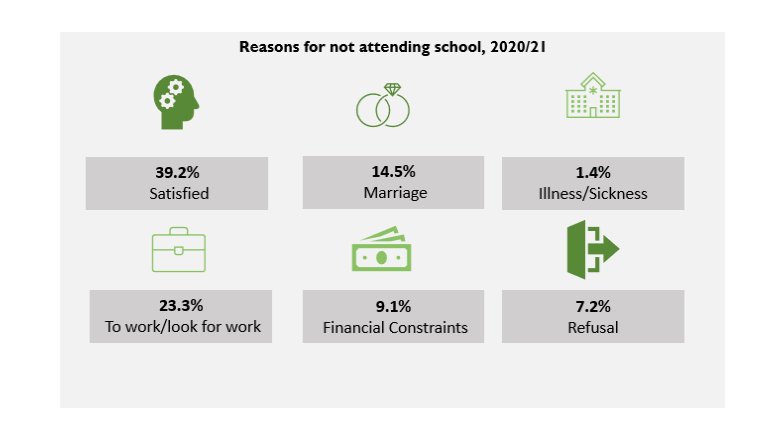
3. Reasons for not attending school
One of the greatest barriers to education continues to be equity in access. Based on the results of the NPS 2020/21:
For those who have stopped attending school, many indicate they are satisfied with the level of education they have acquired.
23 percent indicate they stopped in order to work.
The above two reasons are more prevalent among males and those living in urban areas.
Financial constraints were relatively non-existent in Zanzibar, though common in Dar es Salaam.
Females in rural areas and Zanzibar disproportionately reported that marriage was the reason they were unable to currently attend school.
Health
Health data provides an insight into the general wellbeing of the population. The NPS data shows two health related indicators: births attended by skilled health workers and nutrition of children.
1. Births attended by skilled health workers
Across the 5 waves of NPS over a period of 15 years, there has been a marked increase in the proportion of births attended by skilled health workers.
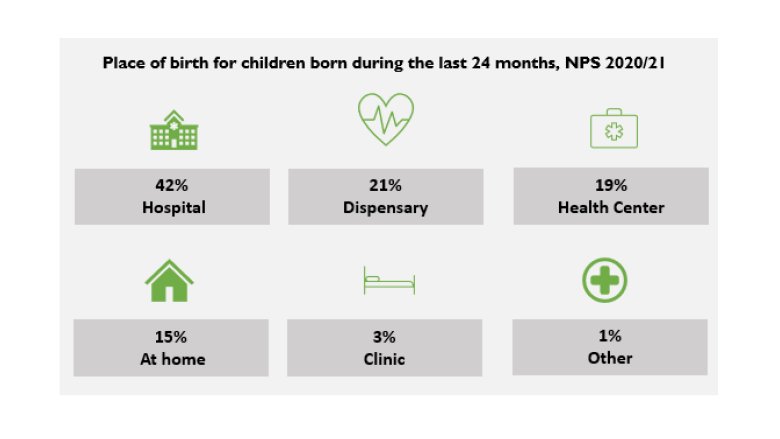
Place of birth:
For children born during 24 months prior to NPS 2020/21, 42% were born in hospitals while 21% were delivered at dispensaries. There was also an increase in the registration of births across the two surveys.
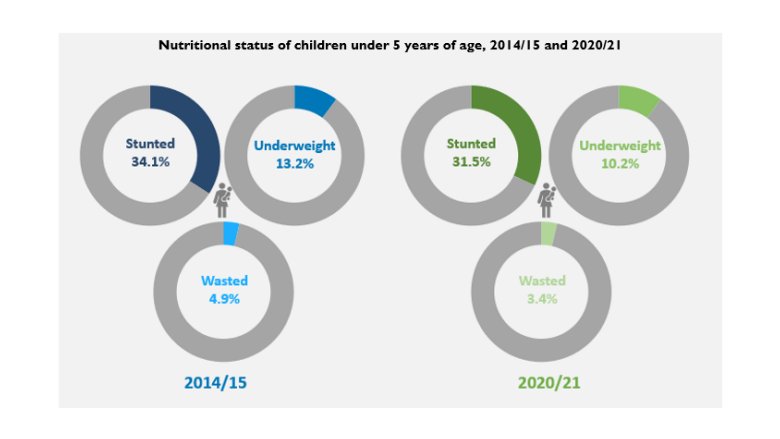
2. Nutrition of children
Considerable progress was made in the realm of health and nutrition of children in Tanzania. Stunting, wasting, and underweight rates for children under 5, each decreased between 2014/15 and 2020/21 with the largest decrease in stunting.
Welfare based transition
Consumption-based welfare transitions evaluate the movement of households in and out of welfare quintiles over time, allowing researchers and policy makers to understand the economic well-being of individuals.
In Tanzania,
Less than half of the poorest households in 2014/15 remained in the lowest quintile, indicating that more than half were able to successfully transition to higher welfare quintiles.
Those who were in the highest quintile in 2014/15 generally remained in the same quintile in 2020/21; more than half stayed in the top most quintile while some transitioned to the fourth quintile.
Labor Market
1. Labor Force Participation
The labor force participation rate remained stable at nearly 80 percent in 2020/21, with the highest rates among those 25-34 years of age and 35-64 years of age.
2. Sectoral Employment
The NPS results from 2020/21 show that:
The agriculture sector: It remains the predominant sector in Tanzania by employing over 60 percent of the workforce. Within the agriculture sector, employment was the most common for the youngest individuals (15-24 years) and oldest individuals (65+ Years).
It was less common for men to be employed in agriculture and service sectors where their participation was lower than the national average and women.
The service industry: This is second most common sector, likely due to increasing urbanization and as non-farm opportunities become more readily available.
Employment in industries: Though the least common, it remained the most transitionary: approximately two-thirds of those employed in the industry sector in 2014/15 had moved into the agriculture and service sectors by 2020/21. In the industry sector, employment was the highest for middle aged individuals.
Food security
There has been a steady progress in the economic and social development of Tanzania and the state of food security has vastly improved. The three food insecurity indicators measured are: worried about not having enough food; experiencing negative changes in diet and experiencing reduced food intake.
Around 42.1 percent of the population did not have enough to eat in 2014/15 and this percentage dropped to 17.5 percent in 2020/21. The average number of months with food shortage also fell, from 3.4 to 3.2 months across this time frame.
The NPS results from 2020/21 show that:
The most common causes of food shortages were drought, poor rains and lack of money.
Financial constraints were much more common amongst non-farm households and those in urban areas.
Drought/poor rains, along with small land size, a lack of farm inputs, and pests, expectedly affected more farm households.
Agriculture
Tanzania remains a predominantly agrarian country. Increasing agricultural productivity through improved and sustainable practices is vital to ensuring the country’s growth and development.
Results from the NPS 2020/21 indicate that:
Engagement in agricultural intensification appears increasingly common in farm households
Use of organic fertilizer, inorganic fertilizer, pesticides/herbicides, and improved seeds all increased between 2014/15 and 2020/21.
Many farm households are now using fertilizers, while nearly half are using improved seeds
Lastly, the surveyfinds a consistent increase in the average yields of maize and paddy crops since 2014/15 across all plot types:
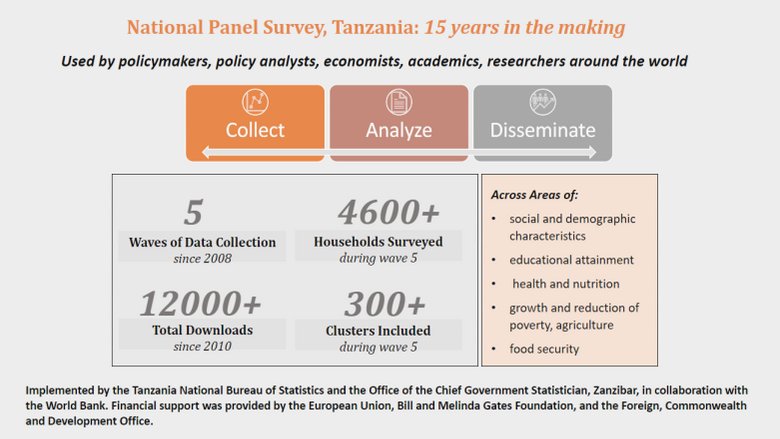
The National Panel Survey (NPS) is Tanzania’s nationally representative longitudinal survey series that collects information on the living standards of the population, including consumption expenditure, farm and non-farm income-generating activities, and other socio-economic characteristics. It is implemented by the Tanzania National Bureau of Statistics (NBS) in collaboration with the World Bank’s Living Standards Measurement Study (LSMS) team, with financial support from the European Union, Bill and Melinda Gates Foundation, and the Foreign, Commonwealth and Development Office.
The NPS was first administered in 2008/09 as the baseline with follow up surveys conducted in 2010/11, 2012/13 and 2014/15, the fifth and most recent round was administered in 2020/21. Sample for the first three waves of the NPS came from the 2002 Population and Housing Census (PHC), while the fourth and fifth waves used the 2012 PHC as the framing sample. There are distinct differences across the five rounds of the survey as they use different enumeration areas as per the population and housing census frame available at the time.
While this article references the changes across the 15 years, it should be noted that the entire survey does not span the same set of households due to a refresh of the sample in 2014/15.
The sample design looks at four analytical strata in Tanzania across the 15 years which include;
Dar Es Salaam
Other Urban Areas in Mainland
Rural Areas in Mainland
Zanzibar
Sample size
The baseline sample in 2008/09 comprised of 409 clusters and 3265 households spread households spread across the four strata, this was followed through 2010/11 and 2012/13. The panel refresh in 2014/15 included 3360 households across 419 clusters. This cohort was most recently re-interviewed in 2020/21, upon which the 2020/21 report is based.
Supporting evidence-informed policymaking
The National Panel Survey (NPS) provides high-quality household-level data to the Tanzanian government and other stakeholders for monitoring poverty dynamics, tracking the progress of national poverty reduction strategies such as the FYPD II and MKUKUTA II, and to evaluate the impact of other major, national-level government policy initiatives.
As a panel household survey in which the same households are revisited over time, the NPS allows for the study of poverty and welfare transitions and the determinants of living standard changes.
As an integrated survey covering a number of different socioeconomic indicators, the NPS compliments other more narrowly focused survey efforts, such as the Demographic and Health Survey (DHS) on health, the Integrated Labour Force Survey (ILFS) on labor markets, the Household Budget Survey (HBS) on poverty, and the Annual Agricultural Sample Survey (AASS) on agriculture.
Available for all
The 5 waves of NPS data have been available online over the past 15 years in the World Bank Microdata Library and the National Bureau of Statistics website and has been downloaded over 12,000 times since 2010. Each round of the survey has been downloaded over 2000 times by policymakers, policy analysts, academics, researchers, and economists around the world.
The NPS supports evidence-informed policymaking in Tanzania by providing information across a variety of key socio-economic areas. These include social and demographic characteristics of households, educational attainment, health and nutrition, growth and reduction of poverty, agriculture, and food security.
Creation of an uniformed dataset for easier and better access
Broad usability and easy comparability are key to survey data. In 2020, the Living Standards Measurement Study (LSMS) team at the World Bank supported the Tanzanian National Bureau of Statistics to launch a Uniform Panel Database (UPD). The UPD combines four waves of the NPS (from 2008/09 to 2014/15) into pooled, module-specific survey instruments and datasets. This further enhanced the richness of the panel information.
The UPD instruments offer ease of comparability across years, with modifications, variances as well as multiple aspects of the questionnaire easily identifiable, making information consistent. By providing all module-specific data over time within compact, pooled datasets, the UPD eliminates the need for user-generated merge between rounds and present data in a clear, logical format, increasing both the usability and comprehension of complex data.
As part of a global effort by the World Bank, LSMS is supporting high-frequency phone surveys in to track responses to and socio-economic impacts of COVID-19 and economic shocks.
This site uses cookies to optimize functionality and give you the best possible experience. If you continue to navigate this website beyond this page, cookies will be placed on your browser. To learn more about cookies, click here.