The Government of the Republic of Serbia is committed to monitoring and promoting poverty reduction and social inclusion. With the prospect of joining the European Union (EU), Serbia began implementing the Survey of Income and Living Conditions (SILC) in 2013, one of the main sources of data used in the EU to monitor these targets. Based on this survey, 24.5 percent of the population (or just under 1.8 million people) in Serbia were at risk of poverty (AROP). At the same time, there is a high degree of variability in living standards within the country.
Detailed knowledge of these geographical disparities would be useful to help the Government design the right policies and programs to support growth, jobs, poverty reduction, and social inclusion.

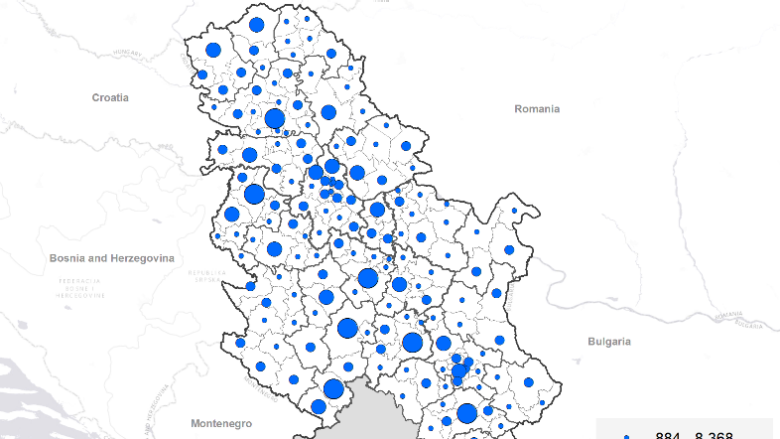
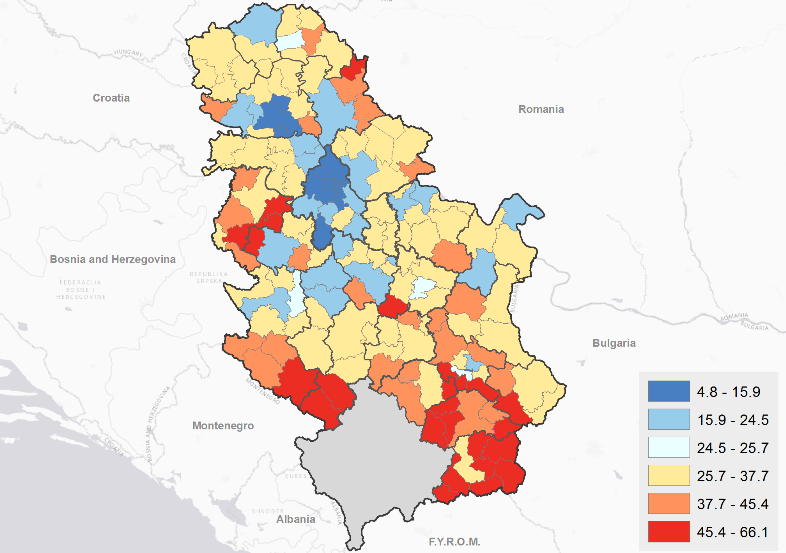
The results show that a number of municipalities in the southern part of Serbia have high poverty incidence. The estimated AROP rate ranges from 4.8 percent in Novi Beograd in the Belgrade Region, to 66.1 percent in Tutin in the region of Šumadija and Western Serbia. Even within the same region, such as Southern and Eastern Serbia, this rate ranges from more than 13 percent in Medijana to more than 63 percent in Bojnik. Some areas with high AROP incidences also have many poor people, and a great number of poor people are in densely populated parts of the country.
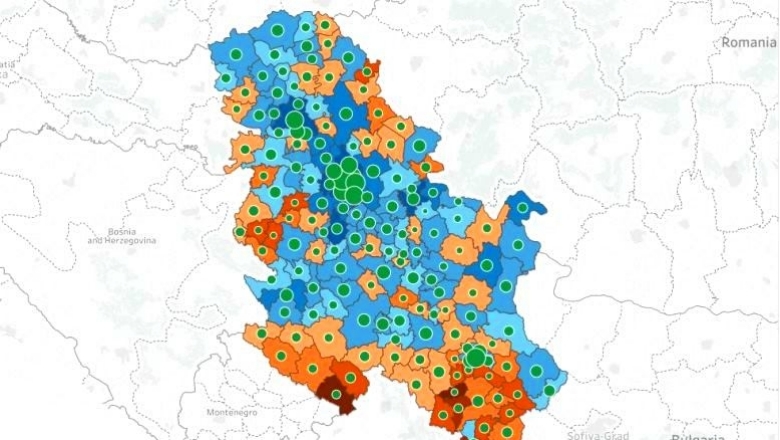
Poverty maps are typically combined with other information, including local knowledge, to inform policy making. Poverty maps are useful to highlight finer geographic variation, identify lagging areas, simultaneously display different dimensions of welfare, and to understand poverty determinants.
They not only build awareness and strengthen accountability, but also potentially help to improve resource allocation and achieve better geographic targeting. Once particular areas or populations are identified to be in greatest need, it is important to combine with local expertise to understand the underlying reasons, which may vary from place to place, to arrive at the most appropriate policy recommendations.