Government analytics refers to the use of data to diagnose and improve the machinery of government, or public administration.
The Handbook introduces a public administration production function to provide an overarching framework to organize the various data sources assessed in different chapters. A production function relates input factors of production to the output of deliverables of an organization, and their eventual outcomes. The productivity of an organization thus depends on the quality and quantity of outputs relative to inputs. Figure 2.1 visualizes the different components of our production function for public administration (Meyer-Sahling et al. 2021; World Bank Group 2019).
FIGURE 2.1 The Public Administration Production Function
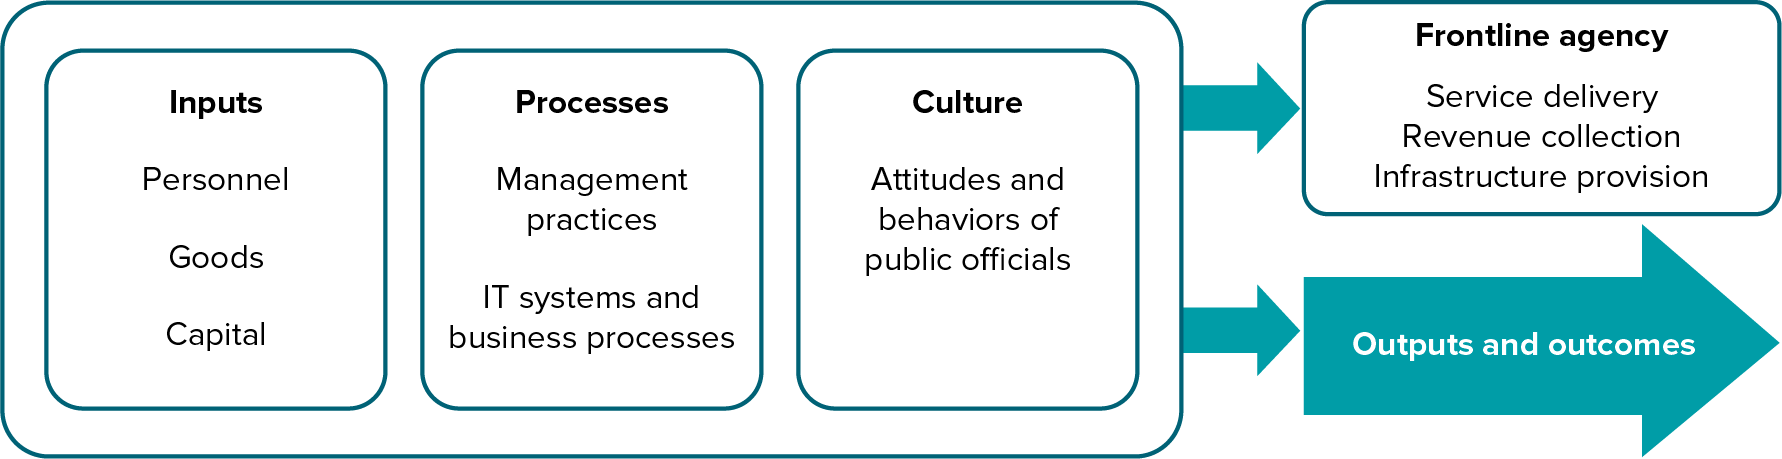
While many core elements coincide with typical private sector production functions (Mas-Colell, Whinston, and Green 1995), the functioning of government administration has been characterized as distinct from that of private firms due to the multiplicity of principals, the ambiguity of tasks, and the presence of principals with political incentives, among other features. In public administration, inputs include personnel (public employees), goods (such as computers), and capital (such as office space).
Outputs refer to, first, the deliverables produced by public administration organizations themselves. For instance, a ministry of finance might issue public sector debt at a certain interest rate. Further, public administration organizations produce outputs (activities) that enable frontline agencies in the public sector—such as hospitals, schools, or police forces—to deliver services and goods to citizens. The outcomes in these examples are better health, education, or public safety, respectively. To fund the outputs, a ministry of finance may oversee budgets that frontline agencies then disburse to deliver their services.
How do public administrations convert inputs (such as personnel) into outputs and outcomes?
In our production function, this conversion is enabled by policies (organizational objectives and work procedures), systems, and management practices, and mediated by norms and behaviors inside public administration. For instance, a ministry of finance may have a policy in place to review a budget for an organization by a certain date. A team lead inside the ministry then manages employees to ensure the task is completed well and on time—such as through effective performance management practices. Those practices and organizational policies shape the norms and behaviors of the ministry’s employees—such as their motivation to work hard—which in turn then allows the ministry to produce outputs (such as a budget review).
By utilizing different data sources and different methods, government analytics can shed light on all parts of this production function and identify bottlenecks, whether overpriced input goods, ghost workers on the payroll, high staff turnover, or slow processing of administrative cases, to name just a few.
Contemplating government analytics along the production function enables analysts to diagnose public administration challenges holistically, and to understand how different data and approaches to government analytics relate.
To illustrate, figure 2.2 maps a number of different data sources analyzed in various chapters to their respective components in the production function. Several types of administrative data have particular strengths in diagnosing inputs into the public administration production function. For instance, payroll data and human resources management information system (HRMIS) data can help governments understand personnel as an input into the public administration production function, such as whether pay of public servants is competitive and fiscally sustainable, or whether staffing levels are adequate (see chapters 9 and 10). Budget data and procurement data can help governments understand spending on goods and capital as inputs into public administration—for instance, whether public administrations acquire similar goods cost-effectively across organizations in the public administration (see chapters 11 and 12).
Government analytics can also shed light on the processes and practices that convert inputs into outputs and outcomes. Surveys of public servants and qualitative measurement have particular strengths at diagnosing management practices. Management quality is fundamentally experienced by employees and a result from the interaction between managers and employees. Surveys can, for instance, ask public servants how they perceive the leadership of their superior or the quality of their performance feedback (see chapter 18). Government analytics can also shed light on the quality of processes inside public administration, such as whether these processes adhere to government procedure or meet deadlines (see chapter 13).
Whether practices and processes effectively turn inputs into outputs and outcomes is, as noted, mediated by the norms, attitudes, and behaviors of public administrators. Surveys of public servants and qualitative measurement are standard practice in many governments to evaluate this component of public administration production—for instance, to understand how engaged, committed, and ethical in their behavior public administrators are (see, for example, chapter 18). HRMIS data often complement rich survey data by providing insights into specific behaviors of public employees that are digitally recorded, such as whether public servants leave the organization, work overtime, or take sick leave (see chapter 9).
Last, public administrations produce outputs and outcomes both of their own (such as a ministry of finance issuing debt), and to enable outputs and outcomes of frontline providers. The productivity of frontline, service delivery agencies such as hospitals, schools, and police forces has been extensively measured, not least as direct contact with citizens enables more direct measurement of service delivery outcomes (such as patient outcomes in hospitals or learning outcomes in schools) (see chapter 29).
This Handbook, instead, focuses on the analytics of administrative outputs and outcomes. Administrative case data are one important source for measurement in such contexts. Such data are often routinely collected by organizations (for instance, the number of tax or social security cases processed) and can be repurposed by organizations to measure outputs and outcomes (such as the amount of tax revenue raised), and thus gauge productivity (see chapters 14 and 15). Beyond administrative data, surveying households and citizens (such as by asking citizens about their trust in public administration organizations) can be an important data source to understand outcomes of public administration (see chapter 28). What will be of most significance to measure and analyze will depend on a specific organizational setting and topic of interest to decision-makers.
FIGURE 2.2 Mapping Different Government Analytics Data in the Public Administration Production Function

The various chapters of the Handbook provide insights into how to use these different data sources to understand how government is functioning and improve the management of public administration. Table 1 below aims to help you identify which chapters might be of help to you, identifying which data sources and related analytics the chapters relate to. Try searching for key words of interest in the table search function.