SUMMARY
The issue
Structural change refers to the reallocation of labor from one low-productivity sector to another, higher-productivity sector and the economic growth resulting from that shift. Therefore, the premise of higher returns to labor outside of agriculture is central to the structural change process. National accounts data suggest that nonagricultural labor in Africa is six times more productive than is agricultural labor. Are productivity differentials really that high? If so, why does so much labor remain in rural areas, and why does rural income diversification remain low? Understanding microlevel cross-sector productivity differences and how they relate to sector allocation is crucial to understanding the forces that power agricultural labor exits.
The Analysis
Data from the Living Standards Measurement Study–Integrated Surveys on Agriculture (LSMS-ISA) are used to measure sector participation, time use, and labor productivity. Those key parameters are examined on a microlevel to reflect the perspective of individuals and firm owners making labor allocation decisions in developing countries. Furthermore, microdatasets contain the variables required to examine the assumptions of macrostatistics. The LSMS-ISA data were analyzed as follows:
- At the individual and household levels, annualized labor supply aggregates were constructed by sector (agriculture, industry, and services) and by activity (household-operated farm enterprises [farms], household operated nonfarm enterprises [NFEs], and wage labor market participation).
- Firm-level labor demand aggregates, which included labor inputs of hired workers and family members, were constructed for farms and NFEs.
- Returns for operating a farm were based on an annual net farm revenue derived from rural income–generating activities calculations. An annualized net firm revenue variable was constructed using either reported profits or household estimates of gross NFE revenue and costs. Returns for labor market participation comprised wage workers’ gross wages, including in-kind payments and gratuities.
- Two types of average labor productivity measures were constructed using the labor supply variables and returns variables: the per worker measure (output per worker per year) and the per hour measure (output per hour of labor supplied to each activity per year).
- All activities were assigned to their respective sectors of the economy using Industry Standard Industrial Classification codes. Sector-level aggregates of labor supply and returns were generated for each household.
The Results
The results of the study are as follows:
- Microlevel cross-sector labor productivity gaps are smaller than those generated using national accounts data. Annual per capita household consumption levels are quite similar between primarily agricultural households and households of other sectors, thus confirming small cross-sector gaps.
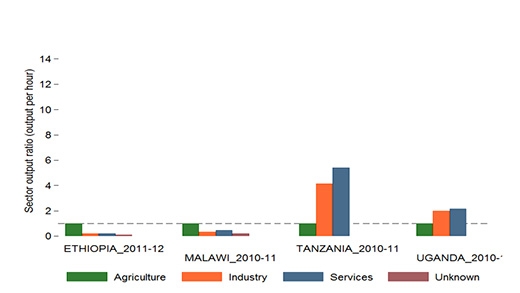
- Cross-sector labor productivity gaps almost vanish when computed on a per hour basis (see figure). The disparity between per worker and per hour measures arises because nonagricultural laborers work, on average, far more hours per year than do agricultural laborers.
- Intersectoral differences in annual earnings per worker arise from differences in employment volume (hours per worker of labor supplied) rather than wages or productivity.
- Rural activities in the industry and services sectors are very closely linked with agriculture. A large portion of NFEs and jobs relate to buying and selling agricultural products, processing raw agricultural materials, or providing services that support farm production.