This year, the report reveals that despite a stable average CPIA score, there is an urgent need for strengthening essential services to achieve inclusive, sustainable growth amid tighter credit markets and limited external finance. The six charts below shed some light on these findings.
No. 1 - SSA scores are broadly consistent with global averages for the second year in a row
The average CPIA score for IDA-eligible countries in Sub-Saharan Africa in 2024 remained roughly equal to 2023, at 3.1 points (out of 6). However, deficient performance in governance offset reforms in other areas, and improvements were concentrated in already well-performing countries. In the aggregate, SSA has made progress in three of the four major categories since 2015 and has even surpassed the global IDA average in clusters A (economic management) and C (policies for social inclusion and equity). Yet, the narrowing gap between SSA and the rest of the IDA countries has been undermined by the region’s much slower improvement in governance (cluster D, public sector management and institutions).
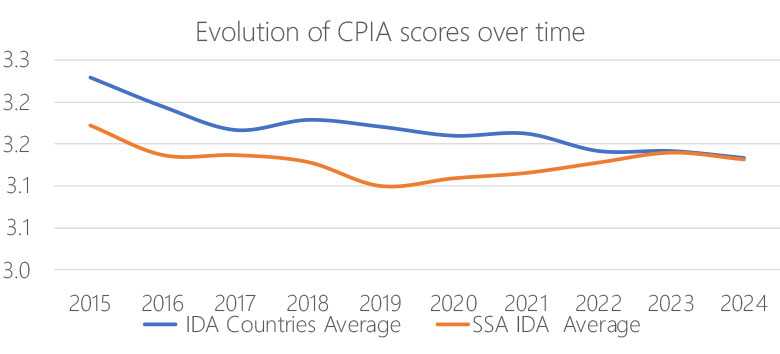
Source: CPIA database, 2025
Note: IDA = International Development Association; SSA = Sub-Saharan Africa.
No. 2 - IDA economies in SSA are performing better
Although the region saw a rise of public discontent in 2024, its economies did relatively well. The region’s real GDP grew by 3.3 percent in 2024, up from 2.1 percent in 2023, boosted by strong global trade and the easing of global financial conditions. In per capita terms, this led from a regional decline of 0.5 percent in 2023 to an expansion of 0.7 percent in 2024. Recent bouts of inflation experienced in many Sub-Saharan African countries have subsided as the median rate of inflation decreased from a peak of 9.3 percent in 2022 to 4.5 percent in 2024. This has allowed central banks to start relaxing monetary policies, leading to an increase in the median investment level among IDA countries, from 24.0 to 25.1 percent of GDP.
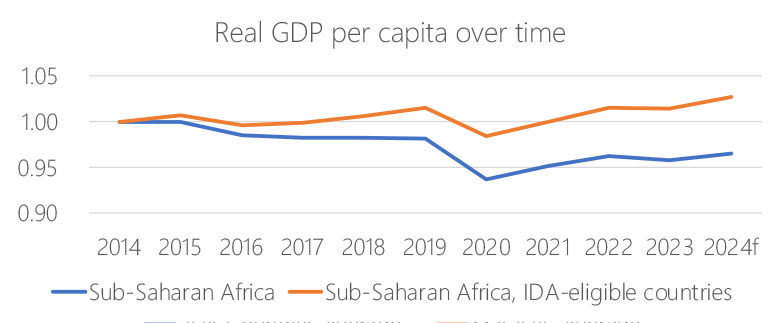
Source: World Bank Macro-Fiscal Modeling Team
Note: f = forecast; GDP = gross domestic product; IDA = International Development Association.
No. 3 - Public service delivery remains a point of contention among citizens
The year 2024 was marked by youth protests (more than seven thousand demonstrations) and a decline in political support for incumbents across the continent. Survey results show growing dissatisfaction with the quality of public services, which continue to lag other regions, particularly in infrastructure, human capital, security, and administrative capabilities.
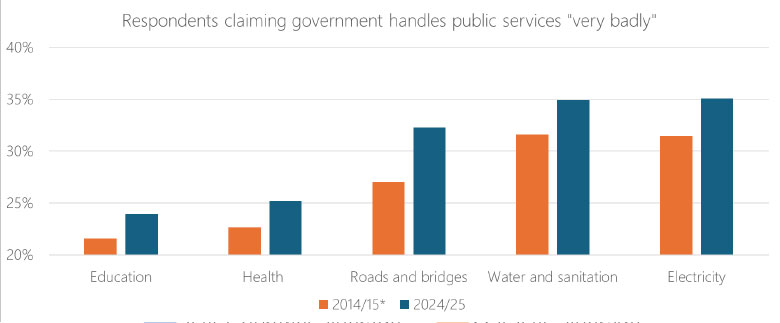
Source: Afrobarometer
Note: The figure shows the proportion of respondents claiming that the government handles public services “very badly.” The sample only includes countries with data available for both sets of surveys for each category. The baseline year for electricity is 2016/17, as data are not available for 2014/15.
No. 4 - Poor service quality is closely tied with low government effectiveness
Service quality in Sub-Saharan Africa has lagged that of other regions. This can be seen directly through the quality of basic infrastructure services, such as transportation, electricity, and internet. The quality of infrastructure services is lower in the region even when correcting for the level of GDP.
While much of this can be attributed to longer-term trends and historical legacies, the current governance of infrastructure investment, regulatory frameworks, and engineering capacity have significant impacts. Low service quality tied to weak government effectiveness continues to hamper economic activity and quality of life for Africans, especially in fragile and resource-rich countries.
Government Effectiveness in Sub-Saharan Africa, by Fragility and Resource Abundance:
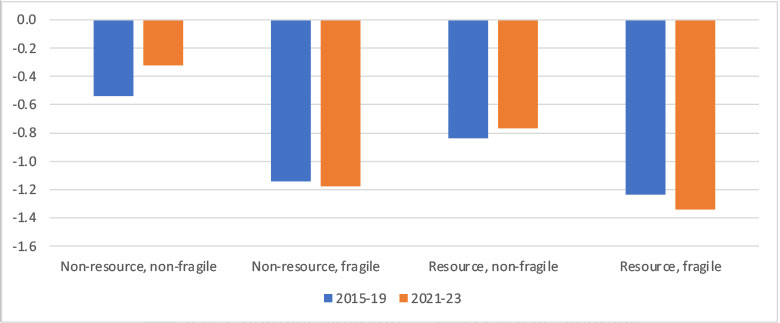
Source: World Governance Indicators
No. 5 - Elevated levels of public debt constrain investment into service delivery
External debt distress risks in Sub-Saharan Africa have increased dramatically over the past decade. The share of countries in debt distress, or at risk of debt distress, rose from 25 percent in 2012, doubling to 50 percent in 2019. This continued to rise to 61 percent, with a slight easing to what are still quite high levels at 53 percent of countries considered at risk.
Some countries in the region have made considerable progress in debt consolidation, however. Of the 40 IDA-eligible countries covered by the CPIA, 26 have debt-to-GDP levels lower than in 2022.
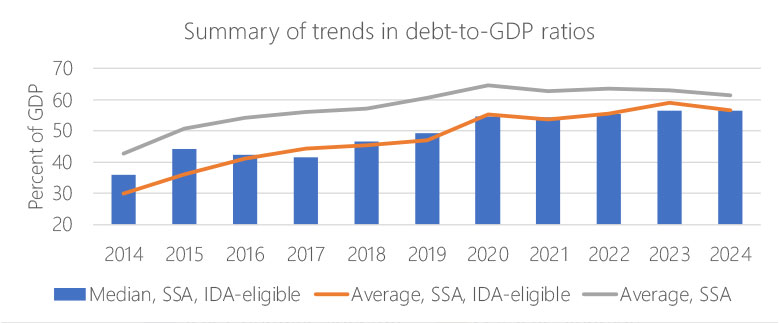
Source: Calculations based on data from the World Economic Outlook, October 2024, International Monetary Fund.
Note: Averages are weighted by GDP. GDP = gross domestic product; IDA = International Development Association; SSA = Sub-Saharan Africa.
No. 6 - Existing resources need to be better managed for more effective service delivery
Improving public financial management (PFM) performance is crucial for promoting fiscal discipline, enhancing service delivery, and achieving positive development outcomes. As populations grow and economies become more complex, managing limited resources becomes increasingly important. Clear financial plans help prevent overspending, while a sound budget ensures that essential expenses are covered, debts are managed, and stability is maintained. Transparency and accountability in financial decision-making are vital for fostering investments that create jobs.
Currently, African policy makers face gaps in transparency, accountability, budget execution, and internal controls that must be addressed directly to improve performance. Moreover, weak debt management increases interest payments and reduces investment capacity. However, several countries have made efforts to reduce unreported extrabudgetary expenditures, while digitization of fiscal processes have been widely implemented in an effort to improve efficiency and transparency. Nevertheless, the region performed lowest of all regions across all aspects related to public financial management except “external audit and scrutiny” according to a 2022 regional comparison of 80 Public Expenditure Financial Accounability (PEFA) assessments.
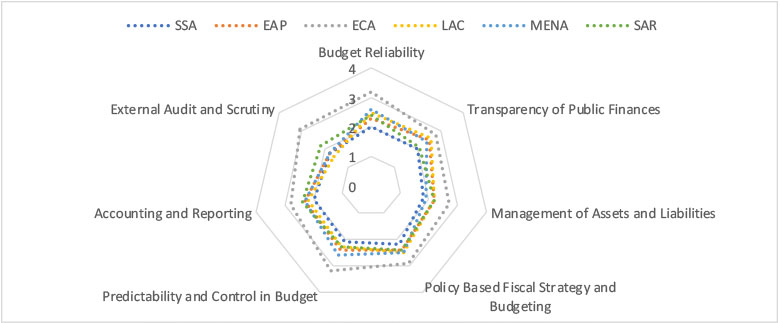
Source: PEFA 2022 Global Report on Public Financial Management, Pefa.org, https://www.pefa.org/global-report-2022/en/report/global-pfm-performance/
Note: EAP = East Asia and the Pacific; ECA = Europe and Central Asia; LAC = Latin America and the Caribbean; MNA = Middle East and North Africa; PFM = public financial management; SAR = South Asia; SSA = Sub-Saharan Africa