- font-medium
- bg_blue_05
STORY HIGHLIGHTS
- Global aid architecture has transformed significantly in the last two decades, with Official Financial Flows (OFF) increasing and benefiting low-income countries.
- However, this led to a complex and fragmented aid architecture and fewer concessional resources. Multiple donors and channels create obstacles for low-income countries with weak implementation capacity.
- IDA is the partner of choice to tackle challenges caused by complex aid architecture. Its global presence and ability to convene stakeholders facilitate better coordination among various efforts.
- lp-body-content
- first-letter
[tweetquote:[tweetText=Over the past two decades, the global aid architecture has undergone a significant transformation. This period has seen a notable increase in Official financial flows (OFF) volume, particularly benefiting low-income countries. ,tweetData=WBG_IDA,tweetHash=IDAworks]]However, this shift has also led to a more complex and fragmented aid architecture, with a noticeable decrease in concessional resources.
Official financial flows increased to US$1 trillion in 2021, a 53% increase from 2010. However, despite this significant expansion, the aid architecture faces substantial challenges as the demand for development finance grows faster than the financial flows. [tweetquote:[tweetText=Low-income countries (LICs) require US$2.4 trillion annually until 2030 to address climate crises, conflict, pandemics, and health concerns.,tweetData=WBG_IDA,tweetHash=IDAworks]] Although the volume of official financial flows has increased, the number of donor channels has also expanded rapidly and organically without benefiting the overall aid architecture.
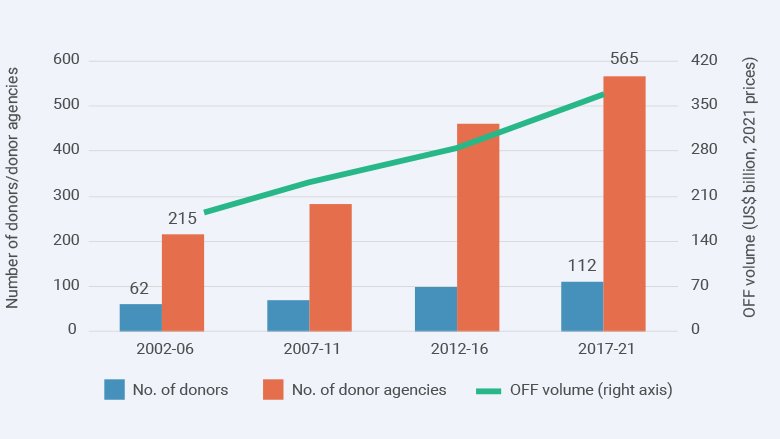
[tweetquote:[tweetText=Between 2002 and 2021, official finance providers increased from 62 to 112. This proliferation reflects the emergence of new donors and the creation of new multilateral institutions. ,tweetData=WBG_IDA,tweetHash=IDAworks]]Over the same period, the number of donor agencies providing finance more than doubled, from 215 to 565.

- lp-body-content
- first-letter
- lp-body-content
The burden on low-income countries
The unwieldy growth has led to significant circumvention of government budgets. Additionally, many donors and varied channels have created obstacles for low-income countries with weak implementation capacity, particularly those already struggling with debt or in conflict and fragile situations.
For example, [tweetquote:[tweetText=Ethiopia's average number of donor agencies has increased by 24 percent in the last 20 years, leaving the country to manage more than 200 donor agencies now. ,tweetData=WBG_IDA,tweetHash=IDAworks]]The situation is dire in small countries. Tajikistan (with a population of under 10 million) has to manage 130 agencies, and Malawi (19 million people) has 171 agencies.
Recipient countries face challenges from multiple donors, each with its requirements, such as project audits, environmental assessments, procurement reports, financial statements, and updates. This results in limited policy leverage and conflicting policies, making the situation more complex for donor and recipient countries.
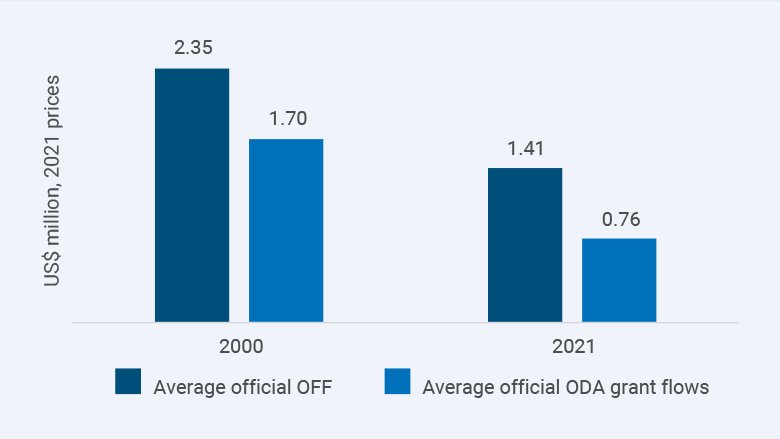
The increase in donor proliferation has led to the fragmentation of aid flows, especially Official development assistance (ODA). The average ODA grant is now half the size of 20 years ago.[tweetquote:[tweetText= Between 2000 and 2021, the size of ODA grants went from an average of US$1.7 million to US$0.8 million. The size of grants is especially concerning since LICs have a weaker capacity, and the higher transaction costs place a disproportionate burden on them.,tweetData=WBG_IDA,tweetHash=IDAworks]]
Towards Greater Balance
A well-balanced and complementary approach is required to enhance aid delivery. A solution that benefits everyone involves combining the strengths of horizontal aid providers through improved partnerships and co-financing.
IDA as a Partner of Choice
In this context, IDA is a partner of choice that offers a solution to the challenges posed by a complex aid architecture. It is a representative player with a global community of countries, which includes 59 donors (both traditional and non-traditional, including all the BRICS) that form the world’s largest fund for low-income countries.
[tweetquote:[tweetText=IDA's global footprint and the ability to convene various stakeholders, including governments, civil society organizations, and other development partners, facilitate better coordination and alignment of efforts.,tweetData=WBG_IDA,tweetHash=IDAworks]] IDA's unique hybrid financial model enables it to leverage additional resources for low-income countries. These features make IDA a vital player in tackling the present development challenges. Therefore, IDA's financing capacity is safeguarded and increased as part of the upcoming IDA21 Replenishment, which should establish a new record financing package.
Over the past two decades, donor channels have increased to more than 200 donor agencies in some countries. Earmarked aid has also increased rapidly, with official financial flows reduced into smaller portions. These trends underline the critical and irreplaceable role of IDA. Over 90% of the IDA's financing is channeled through recipient countries' governments, which helps reduce the risk of aid diversion. [tweetquote:[tweetText=Every IDA donor money is multiplied between three- and fourfold for recipient countries. As the only triple-A fund for the world’s poorest countries, IDA provides unmatched financial efficiency for donors.,tweetData=WBG_IDA,tweetHash=IDAworks]]
00:00 It's a pleasure to be here today talking to you about the global aid architecture.
00:04 I lead research on this topic at the World Bank,
00:07 and then we are looking at how changes in the
00:11 overall global landscape
00:12 of development finance affect recipient countries.
00:16 In my presentation today,
00:18 we'll highlight 4 mega trends that have had
00:21 very important impacts on developing countries.
00:23 I think this is a very timely moment to talk
00:26 about these implications of the implications of these changes,
00:30 because of the last 3 years developing countries
00:33 have been through a roller coaster of crisis
00:36 which have derailed derailed development progress
00:39 and that calls for additional resources to help the poorest countries in the world.
00:44 So,
00:45 uh,
00:50 My presentation will have 3 objectives.
00:52 Well,
00:52 the first one is to present recent trends in
00:55 the official financial flows during the last 2 decades.
01:00 Second objective is to highlight 4 recent
01:03 mega trends in the global wave architecture.
01:05 The third objective
01:07 will be to discuss how these mega trends mirror,
01:10 what could be done,
01:12 and I's role.
01:14 But before I go any further,
01:15 let me say a few words about the data sources and the
01:18 context of of all these changes in the global aid landscape.
01:24 So first,
01:25 the data,
01:26 right?
01:26 So the data is mostly coming from the OECD DAC,
01:30 a credit or reporting system
01:32 that combines official financial flows,
01:35 right?
01:36 Official financial flows are basically
01:38 ODA grants
01:39 plus ODA loans and other official financial flows.
01:44 Other official financial flows and ODA grants,
01:47 ODA loans,
01:48 for example,
01:48 are less concessional than
01:50 ODA grants.
01:52 Then we combine.
01:53 This data from the creditors with data provided by the debtor,
01:58 the World Bank debtor reporting systems,
02:00 right?
02:00 This includes loans from private financial institutions
02:04 and loans from non-DAC donors.
02:06 What is not included are grants from the non-DAC donors because
02:10 there is no comprehensive data set that is available about that.
02:16 OK,
02:17 so let's go into the context and,
02:19 and here I have two very interesting charts.
02:21 The chart on the left shows that official financial flows
02:26 to developing countries have been growing steadily over the last 20 years.
02:31 And
02:33 one important thing to note
02:35 here is that in the beginning,
02:37 right,
02:38 right in 2010,
02:39 for example,
02:40 uh.
02:41 The share of public finance,
02:43 which are represented by the two,
02:46 you know,
02:47 categories in the bottom of the chart,
02:50 represented 60% of official financial flows while financial
02:55 flows represented about 40%.
02:57 If we look at the right hand side of the chart at the very end,
03:02 uh,
03:02 we see that the situation now is completely the opposite with,
03:06 uh,
03:07 you know,
03:07 official
03:08 public sector financing,
03:10 uh,
03:10 representing only 33% and public finance private finance representing almost
03:16 70%.
03:18 So in a way,
03:18 this is good news because it reflects the,
03:22 uh,
03:23 you know,
03:23 development community's effort to increase domestic revenue mobilization.
03:27 In private capital mobilization,
03:29 but there are some caveats to that because we need to work.
03:34 We need to find a way to work better together with the private sector so that
03:38 there are no questions about that transparency
03:41 and that sustainability affecting developing countries.
03:46 Another bit of context is on the right hand side
03:49 where we show official loan commitments to developing countries,
03:53 and we have the top 15 loan providers over the last
03:58 11 years or so.
04:00 So here we see that total,
04:03 you know,
04:04 loan commitments to developing countries totaled
04:07 about $1.7 trillion over this period,
04:11 and the World Bank was the main provider with $428 million approximately,
04:17 followed by China,
04:18 the IMF,
04:19 the Asian Development Bank,
04:21 and Japan in the top five.
04:23 But what is most interesting about this chart.
04:26 Is the emergency of non-traditional donors,
04:31 well,
04:31 the so-called non-traditional donors,
04:33 and here we have,
04:34 uh,
04:34 you know,
04:35 countries like Russia,
04:36 India,
04:38 China,
04:39 Saudi Arabia,
04:40 which are basically the BRICS countries,
04:43 and they are on the top 15 list of loan providers to developing countries.
04:47 So this is a very welcome development.
04:50 And uh we'll see
04:52 uh
04:53 the kind of impacts that this can have on the global we architecture later.
04:58 Now the other bit of context is where
05:01 you know all this funding is going to,
05:04 where is it being allocated to.
05:06 So the good news here
05:08 is that about 40% of ODA has been consistently allocated to the social sectors,
05:13 as you can see
05:14 at the bottom of this figure in the green category.
05:18 Another very interesting point
05:20 is the emergency,
05:23 the category that represents emergencies at home and abroad,
05:27 which is the orange bar right in the middle of the picture,
05:30 which has been,
05:31 has been growing very,
05:33 you know,
05:34 substantively over the last few years.
05:36 It increased from around $2 billion in the year 2000 to about $15.5 billion in 2021.
05:45 So this might reflect a growing focus on
05:48 humanitarian aid abroad and support to refugee countries,
05:52 refugees in donor countries.
05:55 At the same time,
05:57 when we contrast all the commitments to allocated to budget support,
06:02 we see that they have declined
06:04 from 19% to 11% of total ODA,
06:08 and you'll see later again in the presentation
06:12 the relevance of this drop.
06:14 There is a mega trend associated with this.
06:18 So with this bit of context,
06:21 let's move on to the global trends and
06:25 What we see is that,
06:26 well,
06:27 the emergence of new donors has been a very well-received development,
06:31 but they,
06:32 in a way they have been accompanied uh
06:35 uh
06:37 By an exacerbation of some worrisome trends in the global wave architecture.
06:42 So what I'm going to talk to you about
06:45 the next,
06:46 about in the next segment of my presentation are 4 mega trends,
06:50 and they are proliferation
06:52 of donors,
06:53 increasing fragmentation of donor transactions,
06:56 aid transactions,
06:58 circumvention of budget,
06:59 the recipient countries' budgets,
07:02 and the lack of leverage associated with this.
07:04 OK,
07:05 so let me just go into the First mega trend
07:09 of proliferation.
07:10 So proliferation
07:11 it's basically the
07:13 number of new donors and donor agencies that have appeared over the last 20 years,
07:19 and this chart is very telling because you can see while
07:23 the official financial flows have more than doubled over this period,
07:27 they have been accompanied by a very rapid increase in the number of donors.
07:32 So the blue bars show the number of donors in the beginning of the years 2000.
07:37 At 62 donors at that stage,
07:40 and they are now 112,
07:42 so about almost 100% increase in the number of donors,
07:47 but the most explosive growth has been in the
07:50 number of donor agencies that have increased from 215
07:54 in the beginning of of the century to about 565.
08:00 It's so that's a very rapid increase in the number of
08:04 The increase in the number of
08:06 Countries providing official financial flows
08:09 corresponds to the emergence of the new bilateral
08:11 donors such as Eastern and European countries,
08:14 post-Soviet states,
08:15 and Gulf countries.
08:19 So this proliferation of
08:22 donors and donor agencies has had a real impact on the recipient countries with,
08:27 you know,
08:28 some of them
08:29 having to deal with more than 150 agencies,
08:33 donor agencies in the last 20 years.
08:36 So this is illustrated
08:39 in this picture here where you can see the cases of Ethiopia,
08:43 Mozambique,
08:44 and Nepal.
08:45 OK,
08:46 in the,
08:46 as you can see,
08:47 the number of
08:49 Donor agencies in the case of uh Ethiopia
08:54 has just
08:55 increased from 106 to 200209 by 2021
09:01 and the number of donors increased by almost
09:04 100%
09:06 Mozambique showed a very similar trend with the number of donor agencies
09:10 increasing by 70% and,
09:13 you know,
09:14 number of donors
09:15 doubling
09:16 in Nepal
09:17 where the number of
09:19 Donor agencies increased by 100% and reached 170 agencies in 2021
09:25 and again with more than doubling
09:27 the number of donors.
09:28 So if you are familiar with the situation in your country,
09:34 you could very much relate to the situation
09:37 where,
09:38 well,
09:38 countries usually with very low capacity have To deal
09:41 with a number of different players,
09:43 so this increases the,
09:45 you know,
09:45 transaction costs
09:46 and some at sometimes there is,
09:49 there is duplication of efforts and lack of prioritization because each donor
09:54 has its own,
09:55 you know,
09:55 development priorities,
09:57 and this becomes very challenging for
10:00 for developing countries.
10:03 Moving on to the second mega trend that we call fragmentation,
10:08 this is represented by the increasing number
10:10 of donor funded activities of decreasing size.
10:14 OK,
10:14 so
10:16 Higher number of donors,
10:18 donor agencies providing
10:21 more
10:21 financial support to
10:23 different countries but with uh
10:26 smaller average size compared to,
10:28 uh,
10:29 you know,
10:29 the past.
10:30 So here we have a picture contrasting the
10:33 situation at the year 2000 with what is happening
10:37 in the year 2021.
10:39 So the average official financial flow transaction then was 2.4.
10:45 $14 million and it's now $1.4 million.
10:49 OK,
10:49 so it's a significant drop
10:51 of 60%
10:53 and then the the average ODA grant that
10:56 was around $1.7 million is now around $800,000
11:02 which is a drop of 50%.
11:05 OK,
11:06 OK.
11:07 So this is a very important mega trend which basically
11:11 shows a situation that is very concerning for developing countries
11:16 because they have to deal with,
11:18 you know,
11:18 multiple
11:20 agents,
11:20 donor agents,
11:21 different donor channels,
11:22 and at the same time,
11:24 the average size of the transactions has declined.
11:28 So this increases.
11:29 Transaction costs to recipient countries as they
11:32 face severe challenge of that include include including
11:37 rising debt
11:38 and debt distress.
11:39 So the situation is as if you have a pie that
11:42 has been cut into a larger number of smaller pieces and the
11:47 recipient countries
11:48 have to deal with all the costs associated with that.
11:54 Let me then move on to my 3rd mega trend which
11:58 is represented by a very rapid increase in the volume of aid
12:03 that is provided to unleveraged platforms
12:06 that is earmarked to specific sectors or themes.
12:10 So as you can see in this chart,
12:12 there has
12:13 been,
12:14 you know,
12:15 significant growth in the share of ODA provided through vertical platforms
12:20 that increased by 16-fold over the last 20 years.
12:25 Total grant commitments from vertical platforms grew by an average of 27% per annum
12:30 over the same period.
12:32 In contrast to that,
12:34 bilateral donor contributions to the top 5 MDBs,
12:37 including IA,
12:38 have declined in real terms over the last 3 replenishments.
12:42 So,
12:44 one important aspect of this trend is that unleveraged facilities
12:48 take $1 from donors and provide $1 to recipient countries,
12:52 so there is no leverage
12:54 as opposed to the case of either,
12:56 for example,
12:56 that has a leveraging ratio of about 1 to 4.
13:00 OK,
13:00 and you see
13:01 why this is important later when I talk about the implications of the mega trends.
13:08 Now the 4th and final mega trend that we call
13:11 circumvention is represented by the growing number of official financial flows
13:17 bypassing recipient government
13:20 budgets,
13:21 so the
13:23 By 2021,
13:24 nearly
13:26 4 out of 5 projects were implemented by non-government entities,
13:30 and the majority of them was through project-type
13:33 intervention.
13:34 So you recall
13:35 that the share of budget support had declined and This is showing in a way,
13:39 uh,
13:40 in the,
13:40 uh,
13:40 the,
13:41 uh,
13:42 the,
13:42 the magnitude of circumvention because projects have
13:45 been implemented or projects have been,
13:47 uh,
13:48 uh,
13:48 interventions have been implemented through
13:51 project type,
13:51 uh,
13:51 uh,
13:52 uh,
13:52 interventions.
13:53 And more than half of these funds bypass country budgets due,
13:57 due to the use of non-government channels like government,
14:00 donor governments,
14:01 uh.
14:03 Multilateral agencies,
14:05 NGOs,
14:06 and private sector institutions.
14:09 OK,
14:09 so in comparison,
14:11 IA provides close to 100% of its
14:13 development assistance to government agencies directly,
14:17 helping to reduce the problem of circumvention.
14:23 OK,
14:23 now I'm going to talk about two very important implications of these trends,
14:29 and the first one of them is precisely the lack of leverage
14:33 or the missed opportunity to leverage
14:36 additional concessional resources to developing countries.
14:40 So here we have two very telling charts.
14:44 So on the left hand side
14:46 you'll see the bilateral old
14:49 channel through horizontal platforms.
14:51 On the right hand side you'll see the same,
14:55 you know,
14:56 the volume of ODA from bilateral donors channel
15:00 through vertical platforms.
15:02 The blue dot on the charts represents the contributions
15:06 from bilateral donors to the different types of platforms,
15:10 and the red,
15:11 the thick red line
15:13 represents the
15:15 the flows that are coming out of horizontal platforms and vertical platforms.
15:21 So this is to show the leverage ratio
15:25 to make a comparison of the leverage ratio of horizontal platforms against that
15:30 from vertical platforms.
15:32 So on the left hand side
15:34 you see that the red,
15:36 the thick red line is well above the blue line,
15:40 and that basically because horizontal platforms have
15:43 a leverage ratio greater than one.
15:45 Over this period,
15:46 the leverage ratio for the horizontal platforms was around 1.4,
15:52 which means that for each dollar they were able
15:54 to generate $1.4 in additional financing to developing countries.
15:59 During the pandemic that increased to $3
16:02 but it's coming back
16:05 to the average
16:07 over the period.
16:08 So again,
16:08 as I said before,
16:09 IA is able to leverage by a ratio of almost 4.
16:13 OK,
16:14 but then when you look on the right hand side,
16:16 the blue line is on top of the thick red line,
16:20 which means that vertical platforms have a
16:23 a
16:23 a ratio,
16:25 uh,
16:25 leverage ratio of less than one over this period,
16:28 uh.
16:29 Their leverage ratio was 0.6,
16:31 which means that for each dollar
16:33 of donor contribution,
16:34 actually they were able to provide 0.6%
16:39 on average,
16:40 and you can also see the almost exponential growth in the bilateral ODA provided.
16:46 Through
16:47 vertical platforms as opposed to the uh almost flat
16:51 and is slightly declining uh
16:53 uh
16:54 dotted blue line,
16:56 uh,
16:56 which represents the contributions of bilateral
16:58 donors to uh uh horizontal platform.
17:01 So this is a very important implication.
17:05 The second important implication is the volume
17:07 is that the volume of concessional finance
17:10 available to countries with debt vulnerabilities has decreased in recent years.
17:16 So the chart is illustrating that
17:20 and showing the composition of financing for
17:22 the subset of either countries that are
17:24 assessed at a high risk of debt distress or already in debt distress.
17:30 And the share of ODA grants in total official financial flows to these countries
17:34 declined from almost 94% in 2010
17:38 to below 70% in 2016 and again in 2020,
17:43 while the share of ODA loans to non-concessional flows rose from 5%
17:48 to more than 30% more recently.
17:51 OK,
17:51 so in the case of either,
17:53 for,
17:53 for instance,
17:54 uh uh we have been adjusting the terms of uh finance to
17:58 developing countries on uh
18:02 Sorry.
18:06 We have been adjusting the terms of official financial flows to the
18:12 developing countries based on that risk,
18:14 offering only grants to countries at high risk of debt distress or in debt distress,
18:19 and a mix of grants and concessional loans to countries at moderate risk.
18:24 So the second implication is that
18:26 there has been
18:27 declining
18:29 amounts of concessional finance to countries in
18:32 debt distress over the last 20 years.
18:39 OK,
18:40 now.
18:42 Moving on to my final segment,
18:45 the final segment of my presentation,
18:47 I'm going to talk about why do these trends matter,
18:50 what could be done,
18:51 and
18:52 I's role.
18:53 So basically what
18:56 Why do these trends miter?
18:58 So we have seen that there has been an increasingly complex development in
19:03 the global aid architecture that makes
19:06 development more challenging for poor countries,
19:09 uh,
19:10 with the increased donor proliferation and fragmentation.
19:13 which have been accompanied by a decline in the
19:16 volume of concessional resources available to countries developing countries.
19:20 There has also been a lack of leverage
19:22 through the growing earmarking of donor funds,
19:24 which imply less flexibility and inability
19:27 to generate additional resources to address,
19:30 for example,
19:31 global public goods.
19:33 Uh
19:35 There has also been a circumvention of government budgets
19:40 which implies that only about 50% of official financial flows
19:44 go through countries' budgets,
19:46 while 3 out of 4 projects funded by
19:49 official financial flows are implemented by non-government agencies.
19:53 So in a way,
19:54 17 years after the Paris Declaration,
19:56 it's very hard to say that countries are in the driver's seat.
20:01 Then in conclusion,
20:03 I would say the concrete
20:06 actions are needed to address the worrisome trends
20:09 in the global way of the architecture,
20:11 and,
20:11 uh,
20:12 but what could be done about it?
20:14 So,
20:14 uh let me
20:16 Briefly say the 3 things that could be
20:19 done,
20:19 uh,
20:20 that we think could be important.
20:22 So the first one,
20:23 there is an urgent need to create international fora with the participation of
20:28 both traditional and non-traditional donors
20:31 to facilitate the sharing of information,
20:34 increase transparency,
20:35 and better coordination among donors.
20:38 Second,
20:38 it's necessary to channel aid more through recipient countries
20:41 so that they can be in the driver's seat.
20:44 OK,
20:44 in line with the Paris Declaration,
20:46 and third,
20:47 the issues of aid fragmentation and proliferation could be strengthened.
20:53 could be addressed through the consolidation of aid channels and channeling
20:56 more of the aid through organizations which can leverage donor contributions.
21:02 And what is I rolling all of this?
21:05 OK,
21:05 so in this context it's very timely to highlight
21:08 the fact that I stands out as a unique platform
21:12 given its global presence,
21:14 convening power,
21:15 and its unrivaled analytical capacity.
21:18 It's also the largest single provider of ODA grants in the world,
21:22 with the ability to convene various stakeholders,
21:25 stakeholders,
21:26 including governments,
21:27 civil society
21:29 organizations,
21:29 and other development partners which can help
21:32 improve coordination and alignment of efforts.
21:35 Second,
21:36 more than 90% of IDA's financing goes through the recipient governments,
21:41 thus helping to reduce this problem of circumvention of aid,
21:44 as I have mentioned before.
21:46 Build capacity and strengthen country systems.
21:49 And finally,
21:50 IA's unique hybrid financial model allows it to
21:53 leverage additional resources by a multiple of 4
21:56 for the poorest countries,
21:58 helping us to
21:59 generate,
22:00 you know,
22:00 very
22:01 much needed concessional resources for
22:05 countries in a period where they're most
22:07 needed.
22:09 So let me
22:11 finalize by saying that this comparative advantages
22:14 position I as a key player in navigating
22:16 the complexities of the evolving aid architecture and
22:19 addressing the challenges of today's development landscape.
RELATED
- lp-body-content