The World Bank is launching a new Sovereign Environmental, Social, and Governance (ESG) Data Portal. Since the beta version of portal launched in 2019, it has already become an influential resource for the financial sector. It is being used by asset managers, investment banks, rating agencies and other ESG data providers to inform sovereign ESG investments. With this experience, the data portal team saw an opportunity to incorporate user feedback and to build on past successes by filling important data gaps, adding new indicators to the framework and helping users better leverage the full potential of the World Bank’s sovereign ESG data.
With a growing body of research demonstrating the materiality of ESG, investors need to manage and assess ESG risks and opportunities associated with their investments. The World Bank Group collaborates with investors and other market participants to provide financial markets with improved sovereign ESG data and analytics that increase transparency around countries’ sustainability performance. With better ESG data, financial flows can be channeled to more sustainable activities that are better aligned with the Sustainable Development Goals.
New additions to the data framework
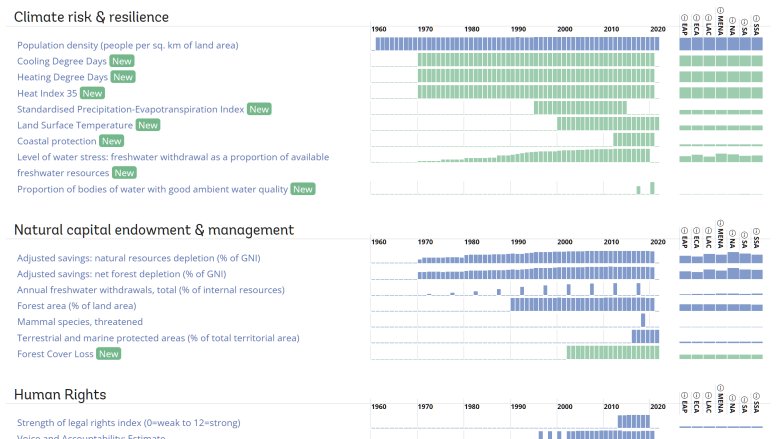
The new portal is now home to 71 ESG indicators, which form the Sovereign ESG Data Framework, along with 40 additional indicators, which span 60 years and 217 economies. The framework incorporates data relevant to all 17 Sustainable Development Goals across three pillars – Environment, Social and Governance – which the World Bank considers crucial for financial representatives to consider when assessing the contribution of investments or policies to sustainable development. The current set of indicators was selected based on surveys with market participants, the World Bank’s own policy analysis and expert teams, and the availability, coverage, and timeliness of data.
The updated portal includes new environmental indicators on water stress, coastal protection, forest cover loss, heating and cooling degree days, precipitation anomalies. The governance pillar now includes a new indicator on economic and social rights. Furthermore, the portal also offers additional data that is relevant to ESG considerations. For instance, the portal shows how each country’s land cover has transitioned over time using satellite data from the European Space Agency. It also allows users to explore each country’s wealth accounting profile, which reflects each country’s “balance sheet” in terms of long-term natural, produced and human capital.
Consistent with the Bank’s commitment to data transparency, the new portal will continue to make high quality ESG data widely available. Users that have relied on the beta version of the portal to obtain their sovereign ESG data can continue to do so in the same way going forward.