
The Poverty and Equity Global Practice team of the World Bank has produced a Spatial Database which compiles a rich set of socioeconomic indicators obtained from household surveys and government reports, presented both in table format and maps. The indicators cover demography, health, education, labor, and access to key services including water, sanitation, electricity, and communication. This Spatial Database allows users to access reliable data at the sub-national level with the goal of providing an interactive platform to facilitate informed decision making.

KM Asad/The World Bank
The Spatial Database has the following components:
1. Zila-level visualization and data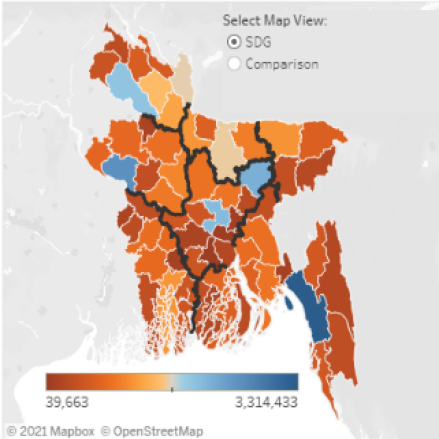
Organized around the Sustainable Development Goals (SDGs), this database contains indicators at the zila (district) level such as poverty, nutrition, fertility, health, access to services, and more. Data are sourced from publicly available government reports, censuses, and household surveys. These include: 2011 Census of Population and Housing, 2016 Household Income and Expenditure Survey (HIES), 2019 Multiple Indicator Cluster Survey (MICS), and others.
2. Cox’s Bazar Panel Survey BaselineRohingya camp in Cox's Bazar. Tanvir Murad Topu / World Bank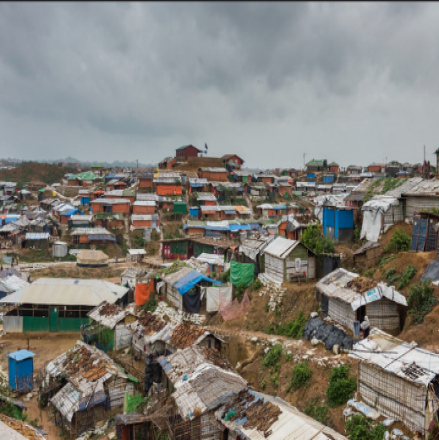
The Cox’s Bazar Panel Survey (CBPS) was carried out in 2019 and tracked information on the camps for the displaced Rohingya people and the surrounding host community in Cox’s Bazar, Bangladesh. A total of 160 indicators are organized by theme: Demographics, Assets, Water and Sanitation-Hygiene, Education, and Labor.
Documentation and Micro data.
3. Poor Urban Areas of Dhaka & ChittagongDhaka city. Dominic Chavez/World Bank
This database holds indicators of poor urban areas of Dhaka and Chittagong. The source for Dhaka is DIGNITY (Dhaka low Income area GeNder, Inclusion, and poverTY) survey, administered in 2018. The source for Chittagong is CITY (Chittagong Low Income Area Inclusion and PoverTY), collected in 2019. Indicators include demographics, education, employment, housing, migration, time management, and others.
Each of the components includes visualization aids including interactive maps and/or charts, with the option to view and download the indicators in excel format. Indicator definitions are available in each component’s glossary.