
Stress Tests
In this station, we will discuss how to determine the sensitivity of projected debt burden indicators to changes in the assumptions. To assess this, the LIC DSF calculates the impact of temporary shocks on the evolution of debt burden indicators in both the external and public DSAs.
 |
|
 |
Why does the DSF need stress scenarios?
- The baseline scenario should represent the most realistic macroeconomic and debt portfolio assumptions based on the most current and best available knowledge.
- However, future realizations may differ from baseline projections due to the uncertainty surrounding the baseline scenario.
- One way to gauge the impact of such uncertainty is through the use of stress scenarios.
Stress Tests and Risk Rating
Recall: Risk ratings are based on several debt ratios breaching their respective thresholds. Breaches of thresholds under stress tests indicate debt vulnerabilities to shocks and affect a country's risk rating.
The most extreme stress test informs the calculation of the mechanical risk signal (defined as the test that yields the highest level of debt on or before the tenth year of projection, which has a greatest chance to breach the threshold among stress tests). In addition, where the test, rather than the baseline, leads to a breach of any of the thresholds, the mechanical risk signal switches from “low” to “moderate".

Standardized Stress Tests
Standardized Stress Tests are universally applied to both public and external DSAs in all LIC DSF countries. They consist of the historical scenario, as well as various scenarios with temporary shocks to real growth, primary balance, exports, other flows (current transfers, foreign direct investment), and domestic currency depreciation. Click on each shock for more details.
Shock Scenarios
Shock Interactions Among Variables
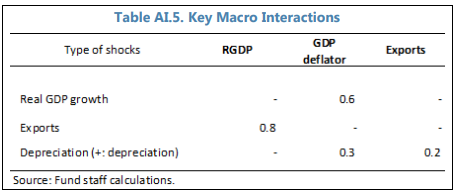
Interactions of key macro variables under the standardized stress tests were identified using event studies and complemented with the literature. The event study analyzed the behavior of key variables – including FX nominal depreciation, real GDP growth, GDP deflator, and export growth – under the relevant economic shocks. To remove the impact of outliers and appropriately capture the characteristics of the interactions, events are defined as cases where an outturn falls near the relevant cutoff for shocks (i.e. its historical average minus one standard deviation). For example, events for the growth shock are defined as those where actual GDP growth falls between a historical average of minus 1.25 and 0.75 standard deviations. Based on this sample of events, elasticities were calculated. These calculations suggest that inflation decreases with an elasticity to real growth of 0.6 and real GDP growth falls with an elasticity to exports of 0.8. Exchange rate pass-through to the GDP deflator is estimated at 0.3 in the year of the shock (Table AI.5). Other interactions are taken from the literature (e.g. Aisen and Hauner (2008) on the domestic borrowing costs-primary balance interaction).
If you would like to find more information check out the DSF Policy Paper
Shock Interactions Among Variables for Primary Balance
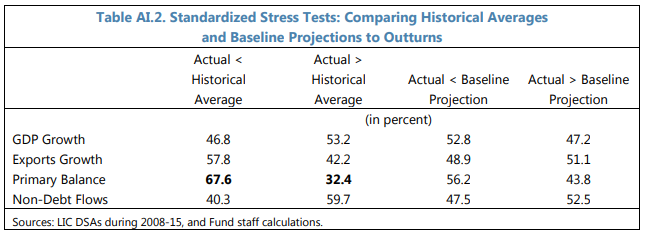
Bias in historical averages appears to be the main driver for the underestimated primary balance shock. As post-shock values in DSA stress tests are set at one standard deviation below historical averages, a key assumption is that the 10-year historical averages and standard deviations are good predictors for the performance of the relevant indicators in the projection years. This assumption did not hold for the primary balance: outturns of primary balances turned out to be lower than historical averages in about 2/3 of all the observations (Table AI.2). On average, the actual primary balance to GDP ratio was 1.2 percentage points lower than historical averages.
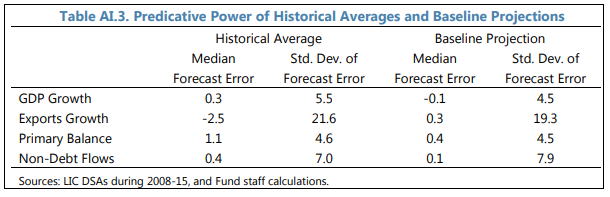
To correct for the possible bias from historical averages, an alternative approach would be to derive post-shock values from baseline projections. The baseline projections turned out to have better predictive power for future performance than historical averages, having smaller median forecast errors as well as smaller standard deviations in forecast errors (Table AI.3). However, basing the shock scenario solely on baseline projections may have shortcomings. In particular, it would not work as envisaged when baseline projections are too optimistic. An effective approach would be to set post-shock values at one standard deviation below the historical average, or the projected value under the baseline, whichever is lower, so to minimize possible biases from historical averages, while at the same time limiting the potential bias from overly optimistic baseline projections. Indeed, calculations using the same sample show that once this approach is applied, the post-shock value of primary balance would be at about the 16th percentile of the distribution of actual outturn, in line with other shocks.
If you would like to find more information check out the DSF Policy Paper
Shock Design
The following macroeconomic variables are set to their respective 10-year historical averages: real GDP growth, primary balance-to-GDP ratio, GDP deflator, non-interest current account, and net FDI flows. This scenario is used as a realism check for the baseline scenario and does not inform mechanical risk signals.
Shock Design 
In the second and third projection periods, real GDP growth set to its historical average minus one standard deviation, or the baseline projection minus one standard deviation, whichever is lower.
Shock Interactions among Variables
- Inflation decreases with assumed elasticity to growth equal to 0.6.
- Primary balance deteriorates due to the revenue-to-GDP ratio remaining the same as under the baseline, while the ratio of non-interest expenditures-to-GDP increases to maintain the baseline level of spending.
Shock Design
In the second and third projection periods, primary balance-to-GDP ratio set to its historical average minus one standard deviation, or the baseline projection minus one standard deviation, whichever is lower.
Shock Interactions among Variables
- For a LIC with domestic market financing, domestic borrowing costs rise by 25 basis points for each 1 percent of GDP in primary balance deterioration.
- For market-access LICs, external commercial borrowing costs increase by 100 basis points for each 1 percent of GDP in primary balance deterioration, or by 400 basis points, whichever is lower.
Shock Design
In the second and third projecion periods, nominal export growth (in USD) is set to its historical average minus one standard deviation, or the baseline projection minus one standard deviation, whichever is lower.
Shock Interactions among Variables
- Real GDP growth rate is lowered with an elasticity to exports of 0.8
Shock Design
In the second and third projection periods, current transfers-to-GDP and FDI-to-GDP ratios are set to their historical average minus one standard deviation, or the baseline projection minus one standard deviation, whichever is lower.
Shock Interactions among Variables
- No interactions.
Shock Design
In the second year of projections, there is a one-time depreciation of domestic currency by 30 percent, or the size needed to close the estimated real exchange rate overvaluation gap, whichever is larger.
Shock Interactions among Variables
- Real net exports, as a percent of GDP, increase starting in the year following the shock assuming elasticity to real depreciation of 0.15.
- In the year of the shock, pass-through to inflation is set to 0.3.
Shock Design
Apply all individual shocks above(except for the Historical Scenario) at half of each shock magnitude.
Shock Interactions among Variables
- All the interactions from each individual shock scenarios.
 Key Messages
- The LIC DSF template automatically applies the historical scenario and the following standardized stress test scenarios to both external and public DSAs: the real GDP growth shock, the depreciation shock, and a combination of all shocks scenario. In addition, the public DSA includes the primary balance shock and the external DSA features export and other flows shock scenarios.
- The historical scenario sets the key drivers of debt dynamics for external and public debt to their respective historical averages (over the last 10 years). This is used for a realism check and does not inform mechanical risk signals.
- The sizes of the other standardized shocks (except for the depreciation shock) are set to the historical average minus one standard deviation or the baseline projection minus one standard deviation, whichever is lower.

Tailored Stress Tests
Tailored Stress Tests are related to so-called “tail” risks. They only apply to a country if relevant and likely, and they have implications for a country's risk rating. The exception is the Contingent Liabilities stress test, which applies to all countries.
1. Contingent Liabilities
2. Natural Disasters
3. Volatility of Commodity Exports
4. Market-Financing Shocks
For each tailored stress scenario, default parameters of the stress scenario are based on cross-country averages but are expected to be customized based on country-specific characteristics.
Contingent Liability Shock
Users can customize the contingent liability shock by filling in the following table in the template:
 Exercise: Determine the size of the contingent liability shock in the tailored stress test. Modify the assumptions below
 to see the overall size of the CL stress test.
The default shock of 2 percent of GDP will be triggered for countries whose government-guaranteed debt is not fully captured under the country's public debt definition. If it is already included in the government debt, and risks associated with SOE debt not guaranteed by the government are assessed to be negligible, it may be reduced to 0 percent.
 Considerations
- Are there known additional contingent risks in the financial sector? For example, those identified in an asset quality review?
- Do the missing elements of general government have the potential to generate debt vulnerabilities? For example, do budgetary funds have a history of government bailouts?
- Does a specific SOE pose a risk to debt sustainability? Can it cover its gross financing needs over the next several years?
- Is the PPP capital stock larger than assumed? How risky is the PPP to the government? Are the likely costs greater than 35 percent of the nominal value? PPPs are typically related to infrastructure, but they could also be projects in other sectors of the economy, such as in the healthcare system.
- Also consider any other shock relevant to your country, such as those based on specific historical circumstances or potential missing elements of the general government.
In the template, this table is in the “Input 6 – Tailored Tests” sheet.
Considerations
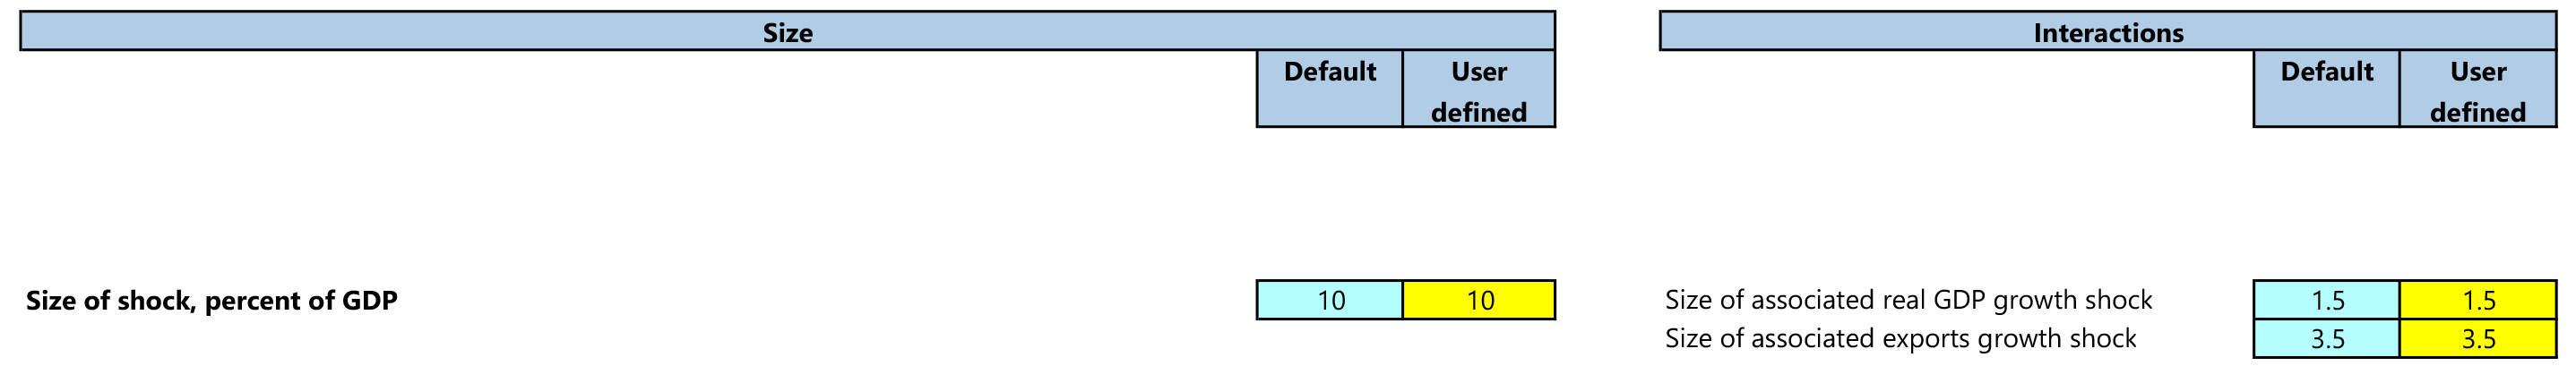
- Does the baseline macro framework already assume an average impact from natural disasters? Ensure that double-counting is avoided.
- Do you have empirical evidence that the size of the shock should differ from the default setting of 10 percent of GDP? Would that impact the ability to cover your gross financing needs over the next several years?
- Do you have empirical evidence that the default setting of export and GDP growth interactions should be changed?
Volatility of Commodity Exports
| Shock Trigger | Shock Size and Interactions |
|---|---|
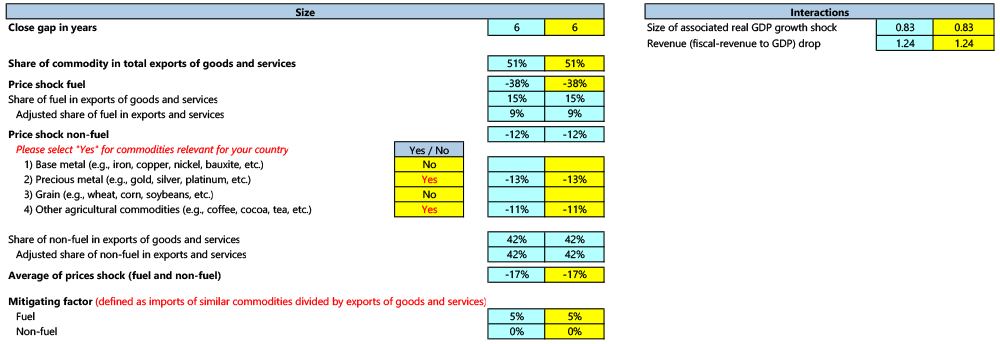
| Countries with commodity exports exceed 50 percent of exports of goods and services | Commodity exports prices fall by 1 standard deviation, and gap closes over 6 years. Interactions include reduction in: |
| Commodity exports = fuel + non-fuel exports | real GDP growth by 0.5 percentage points from the baseline  |
| Based on the last three years shares (of fuel + nonfuel commodity exports) provided by you | fiscal revenues-to-GDP by 0.75 percentage points from the baseline |
| GDP deflator by the impact of the commodity price gap in the first year of the shock, converging to the baseline in 6 years |
In the template, this table is in “Input 6 – Tailored Tests” sheet.
Considerations
This test can be adapted to take into account a contemporaneous fall in the price of a key import and can be netted out for the purposes of the shock as a “mitigating factor” in the template. For example, exporting crude oil and importing refined oil.
- Is there a reason to model a bigger/smaller shock to commodity prices?
- What is the historical evidence of the commodity/country/region during the commodity cycle? Is it different from the default setting?
- Do you have empirical evidence that the default setting of export and GDP growth interactions should be changed?
External Market Financing Shock
For countries with market access, this scenario helps focus discussions on potential market stresses during upcoming rollovers.
| Shock Trigger | Shock Size and Interactions |
|---|---|
| Countries with at least one of the following: | A combination shock, which includes: |
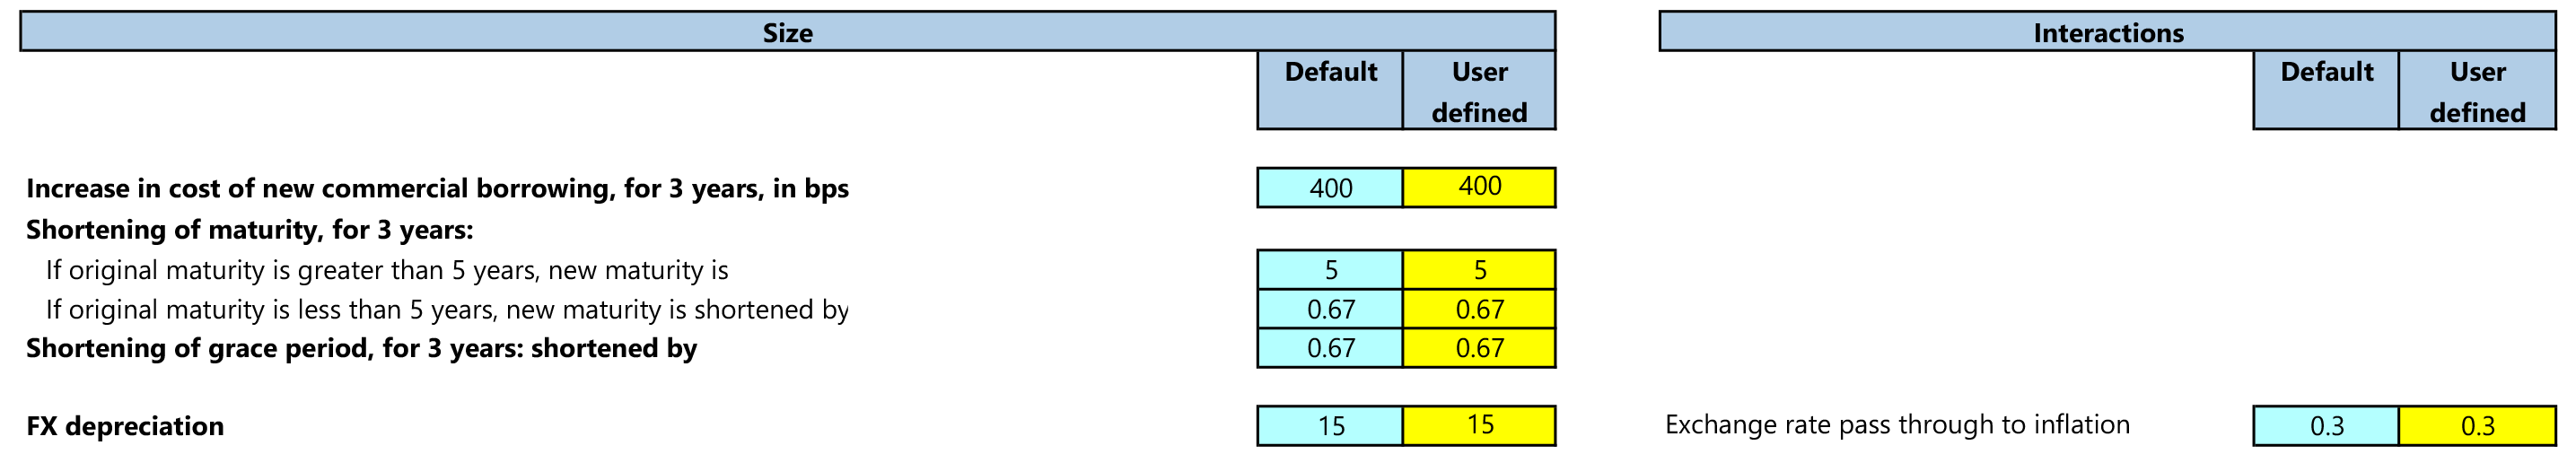
| Have outstanding Eurobonds, and/or have access to the international financial markets on a durable and substantial basis | An increase in borrowing costs of market-based financing of 400 bps (sustained for 3 years) and shortening to 5-year maturity or shortening by 2/3 of the original maturity that is less than 5 years for newly issued market debt; and |
| One-off nominal depreciation equivalent to 15 percent | |
In the template, this table is in the “Input 6 – Tailored Tests” sheet.
Considerations
- Is there empirical country-specific evidence suggesting the response to a market financing shock in borrowing costs/depreciation/maturity shortening may be different?
Key Messages
- The size of the contingent liability shock must be customized depending on the coverage of public debt.
- This requires information about the size of potential contingent liabilities that may arise from Public-Private Partnerships (PPPs), the financial sector, explicit government guarantees, and other public sector obligations which are not included under the baseline scenario.
- Customization of shock parameters for other tailored stress tests should be based on your country's characteristics.
- Some stress tests will require more information to correctly calibrate shocks, such as commodity export composition to help inform the commodities shock.

Customized Stress Tests
In addition, fully-customized stress test scenarios are relevant for specific risks not covered by the template.
Fully-Customized Scenarios
Examples include, but are not limited to, the following scenarios:
- Idiosyncratic risks, such as an epidemic;
- Large delays in investment projects; and
- Policy slippage where different outcomes lead to very different debt paths.
Customized scenarios can also be used to investigate alternative financing strategies and their implications without affecting the risk rating, such as a scenario for achieving sustainable development goals, a debt restructuring scenario, or a higher grant scenario.
While fully flexible in their design, customized scenarios inform the risk ratings in the same way that other stress tests do.
There are two options of incorporating customized stress tests into the LIC DSF:
1. Use the “Customized Scenario” sheets in the template to design a stress test.
2. Create an alternative baseline and enter them in separate template from the original baseline.
 Takeaways for Station 5
- Stress test scenarios are critical for understanding the nature of risks to which a LIC is vulnerable and to inform the risk rating.
- Tailored stress tests help provide insights on specific risks relevant for some LICs.
Travel to Station 6 for the next part of your journey
 |
 |
 |
 |
|
 |
 |
 |
 |
 |
