
Realism
In this third station, you will be guided through the tools used to assess the realism of medium- to long-term macroeconomic projections discussed in Station 2. These projections constitute the baseline scenario and are critical inputs to the DSF.
 |
|
|
 |
DSAs are only useful if the assumptions underlying them are realistic, rather than optimistic or pessimistic. To promote this realism, the 2017 review of the LIC DSF includes four realism tools.
These realism tools scrutinize the past and future drivers of debt dynamics, the planned fiscal adjustment, the potential impact of fiscal adjustment on growth, and the public investment-growth nexus.
Why do we need realism tools?
The realism tools are designed to examine the baseline assumptions and are not meant to be prescriptive. Rather, they encourage a deeper analysis of inputs by:
- Helping you assess the key macroeconomic and debt projections, which are the main inputs into the LIC DSF;
- Providing a point of comparison for forecasts, whether drawing on a country’s own history, cross-country experience, or on relationships drawn from economic theory;
- Informing you of situations in which important drivers of the macroeconomic baseline debt projections deviate from experience with either an optimistic or a pessimistic bias; and
- Highlighting the realism of your key assumptions to focus the DSA write-up on discrepancies within the macroeconomic framework.

Summary of the LIC DSF Realism Tools
The LIC DSF includes four realism tools, with each examining a different aspect of the macroeconomic framework.
- Drivers of Debt Dynamics: What has contributed to unexpected debt increases in the past, and what is assumed going forward?
- Planned Fiscal Adjustments: What is the assumed fiscal adjustment? Is it realistic relative to cross-country historical experience?
- Growth and Fiscal Adjustment: What is the assumed relationship between fiscal adjustment and growth?
- Growth-Accounting and Public Investment: What is the assumed relationship between public investment and growth?
Tool 1: Debt Dynamics
The three charts below help you to identify and scrutinize historical and projected drivers of debt dynamics. Each illustrates the evolution of projections of external and public debt-to-GDP ratios over DSA vintages (from one year and five years ago).
Evolution of Public Debt 
Decomposition of Public Debt Drivers
This chart compares the drivers of debt over the past 5 years to those over the first 5 years of projections. The colors show the key macroeconomic-variable contributions to the changes in public debt-to-GDP ratios.
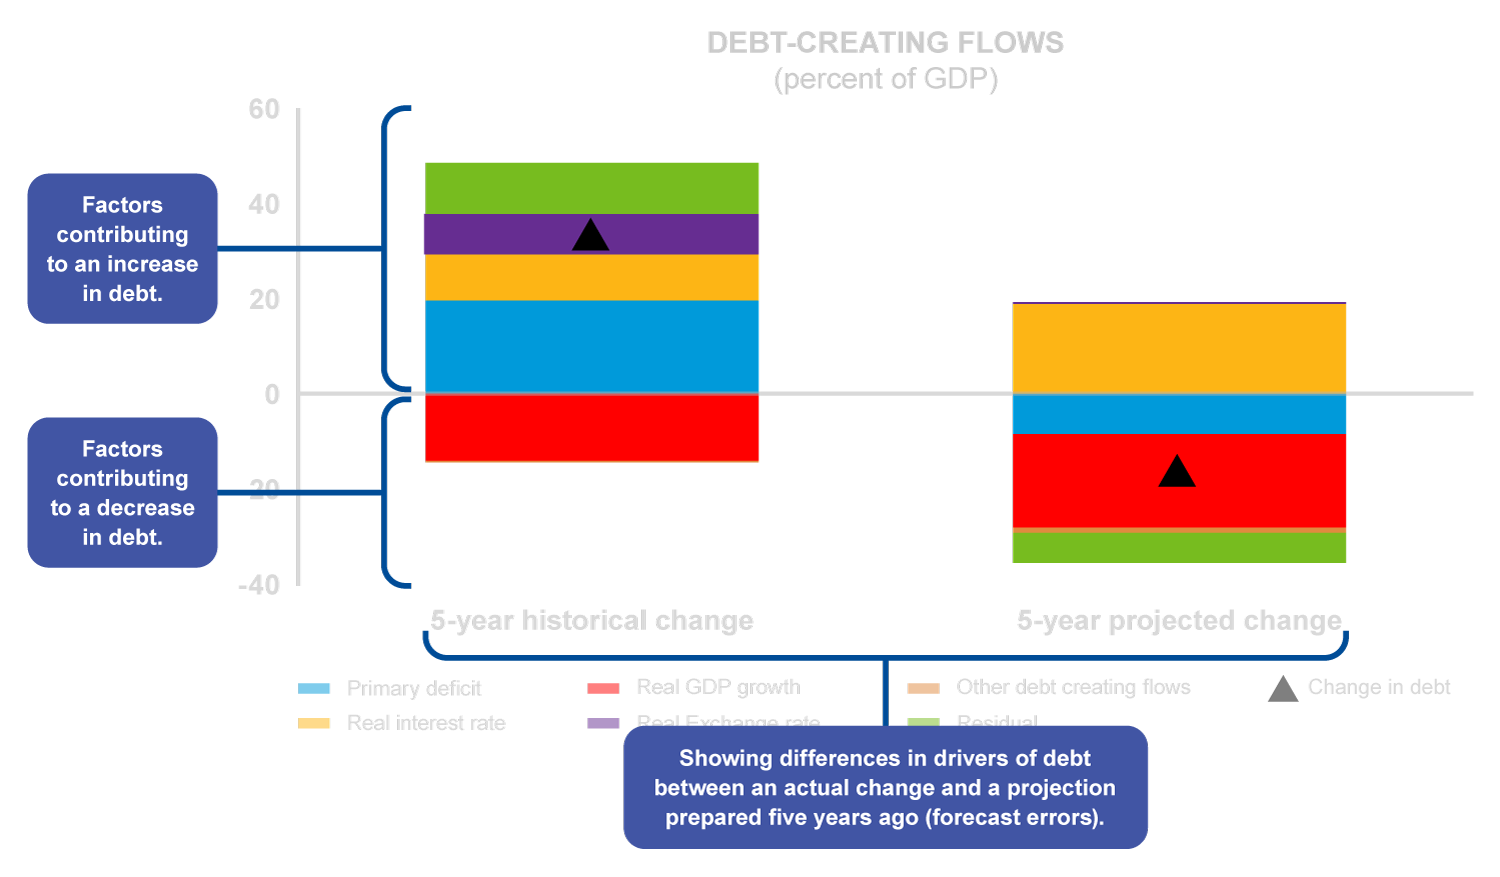
Decomposition of Public Debt Drivers 
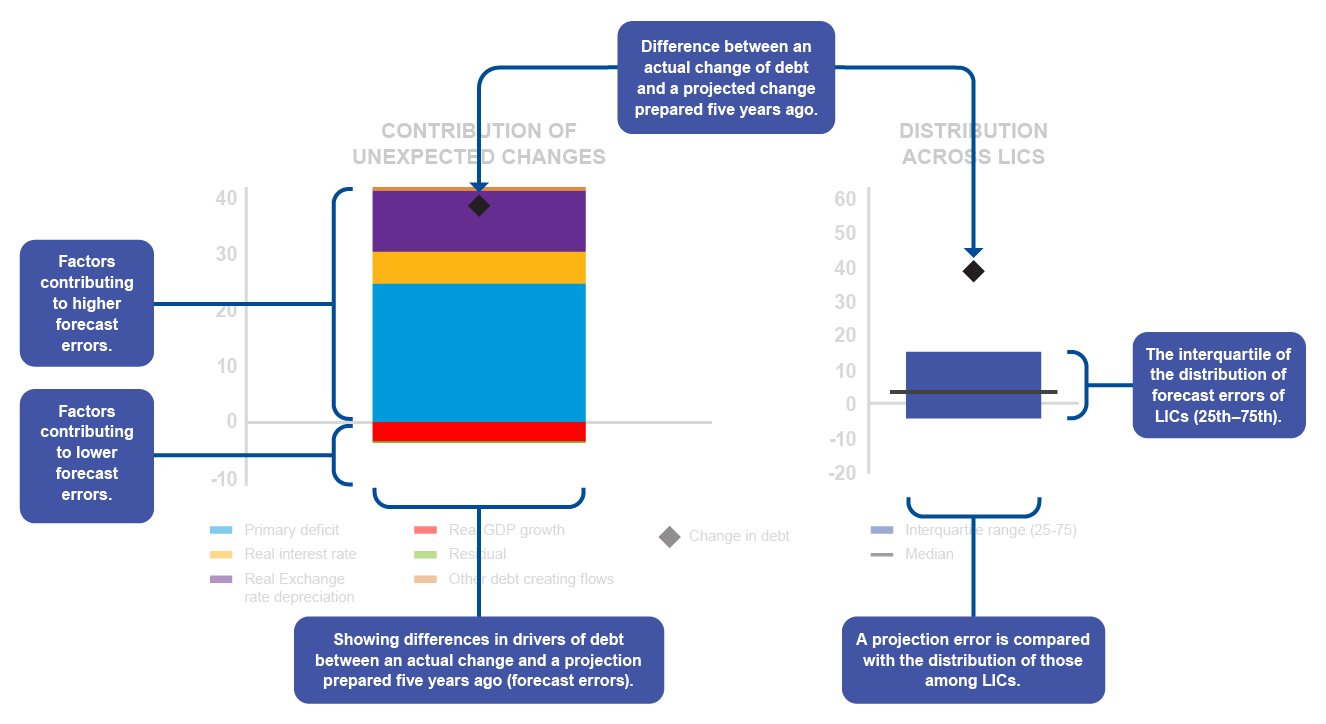
Debt Forecast Errors
This chart decomposes the forecast error, or the unexpected change in debt, which is equal to the actual debt-to-GDP ratio minus the one forecast in the DSA 5 years ago.
The individual country forecast error is then compared to the forecast errors by all the other LIC DSF country forecast errors.
The black diamond above the shaded blue area of the right bar indicates that the individual country forecast errors was much higher than the 75th interquartile of LICs.
Debt Forecast Errors

Tool 2: Planned Fiscal Adjustment
Growth and Fiscal Adjustment
The upward sloping growth projections are hard to reconcile with any positive value of the fiscal multiplier, as illustrated by the growth projections under the assumed fiscal adjustment that are plotted for the values of the multiplier ranging between 0.2 and 0.8.
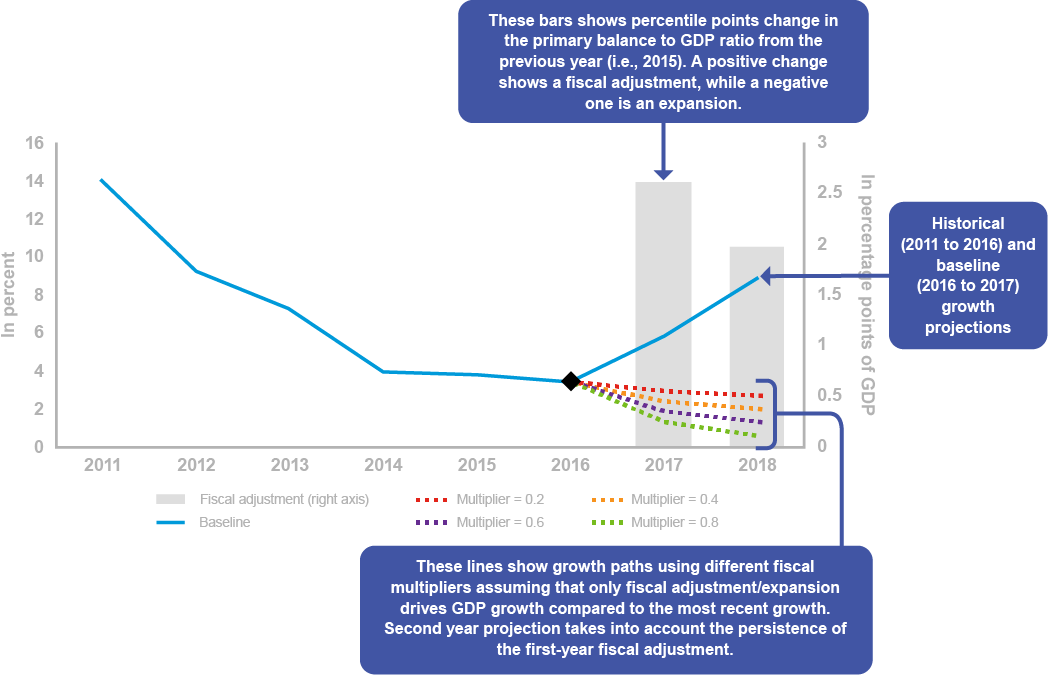
Tool 3: Growth and Fiscal Adjustment 
The growth and fiscal adjustment tool identifies when assumed growth rates in countries undertaking fiscal adjustments suggest further examination of the growth trajectory.
Growth and Fiscal Adjustment
Recall: Fiscal Multiplier
The fiscal multiplier is a summary statistic of the impact that fiscal tightening has on GDP.
A multiplier of 0.4 (the estimated average in LICs) implies that, with all other factors constant, a fiscal adjustment that results in a 1 percentage point improvement in the primary balance would reduce GDP growth by 0.4 percentage points in the year of the adjustment.
Tool 4: Growth and Public Investment
Public Investment
The growth accounting methodology is based on a standard functional form assumption for the aggregate production function. Specifically, the aggregate production function is assumed to be isoelastic in government capital:
𝑌𝑡 = 𝐺𝑡𝛽𝐹(𝐴𝑡,𝐾𝑡,𝐻𝑡)
where 𝑌𝑡 is real GDP; 𝐺𝑡 is government capital; 𝛽 is the output elasticity of government capital, and 𝐹(𝐴𝑡 ,𝐾𝑡,𝐻𝑡) is a function of productivity (𝐴𝑡), private capital (𝐾𝑡), and human capital (𝐻𝑡) that does not need to be fully specified. Given this functional form, there is a simple decomposition of output growth:

where the first term  represents the contribution of changes in government capital to growth, and the second term 𝜀𝑡
represents the contribution of all other factors and productivity to growth. This decomposition captures only the direct effects of changes in government capital on growth, and does not consider possible endogenous responses of productivity or private
factors of production to increases in government capital. Country teams interested in pursuing these richer channels can do so with the help of more sophisticated models such as those referenced above. Based on existing literature,
this tool sets the output elasticity of government capital at 𝛽 = 0.15.1
represents the contribution of changes in government capital to growth, and the second term 𝜀𝑡
represents the contribution of all other factors and productivity to growth. This decomposition captures only the direct effects of changes in government capital on growth, and does not consider possible endogenous responses of productivity or private
factors of production to increases in government capital. Country teams interested in pursuing these richer channels can do so with the help of more sophisticated models such as those referenced above. Based on existing literature,
this tool sets the output elasticity of government capital at 𝛽 = 0.15.1
The growth rate of the government capital stock can be inferred from the path of public investment, together with assumptions on an initial stock of government capital, depreciation rates, and public investment efficiency. The accumulation equation for government capital is:

where 𝛿 is the depreciation rate (set at 0.05), 𝜙𝐹 is the public investment efficiency (that can be calibrated using FAD’s estimates), and 𝑖𝐺𝑡 is the public investment path. This equation is used to project the path of the government capital stock, from which growth rates of the government capital stock can be calculated.
The analysis can accommodate assumptions about the “efficiency” of past and future government investment. In this context, “efficiency” refers to the fraction of a dollar of government investment that turns into government capital. Incorporating efficiency involves (i) replacing the projected future investment rate with 𝜙𝐹𝑖𝐺𝑡, and (ii) scaling down the historical capital stock series by a factor 𝜙𝐻. The efficiency parameters 0 < 𝜙𝐹 ≤ 1 and 0 < 𝜙𝐻 ≤ 1 reflect judgement as to the efficiency of future and past investment. The adjustment for historical efficiency is important: if past efficiency of public investment was low, then the accumulated investment flows on which the historical capital stock series are based are an over-estimate of the actual stock of government capital, and the marginal productivity of an additional dollar of government investment is underestimated (see Berg and others (2015)). 2While DSF users can separately specify the historical and future efficiency parameters, the analysis in the realism tool depends only on the ratio of the two, 𝜙𝐹/𝜙𝐻. The benchmark assumption is that 𝜙𝐹 = 𝜙𝐻 = 1 and departures from the benchmark, particularly those that imply an improvement in efficiency, would require careful justification by country teams.
1Bom and Ligthart (2014) perform a meta-analysis of 68 studies on the productivity of government capital and find an average output elasticity of government capital among mostly OECD countries of 0.11. Ligthart and Martin-Suarez (2011) perform a similar analysis, finding an average output elasticity around 0.15. More recent econometric analysis of the relationship between physical infrastructure stocks and output in low-income developing countries in Calderon, Moral-Benito, and Serven (2015) suggests output elasticities ranging from 0.06 to 0.18.
To get more information please check out the LIC DSF Policy here.
Growth-Accounting and Public Investment
Projected growth rates are decomposed into two contributing components:
- Changes in the government capital stock due to public investment, and
- All other sources.
These two components of growth can then be compared with historical data and all previous projections.
Chart 1: Investment Rates
- This tool can help assess the consistency of growth projections in countries with a scaling-up or scaling-down of public investment.
- The chart below shows that public investment projections will scale-up in the current 2013 DSA at a much higher rate than in the past, and than in what had been projected in the previous 2012 DSA.
Chart 1: Investment Rates
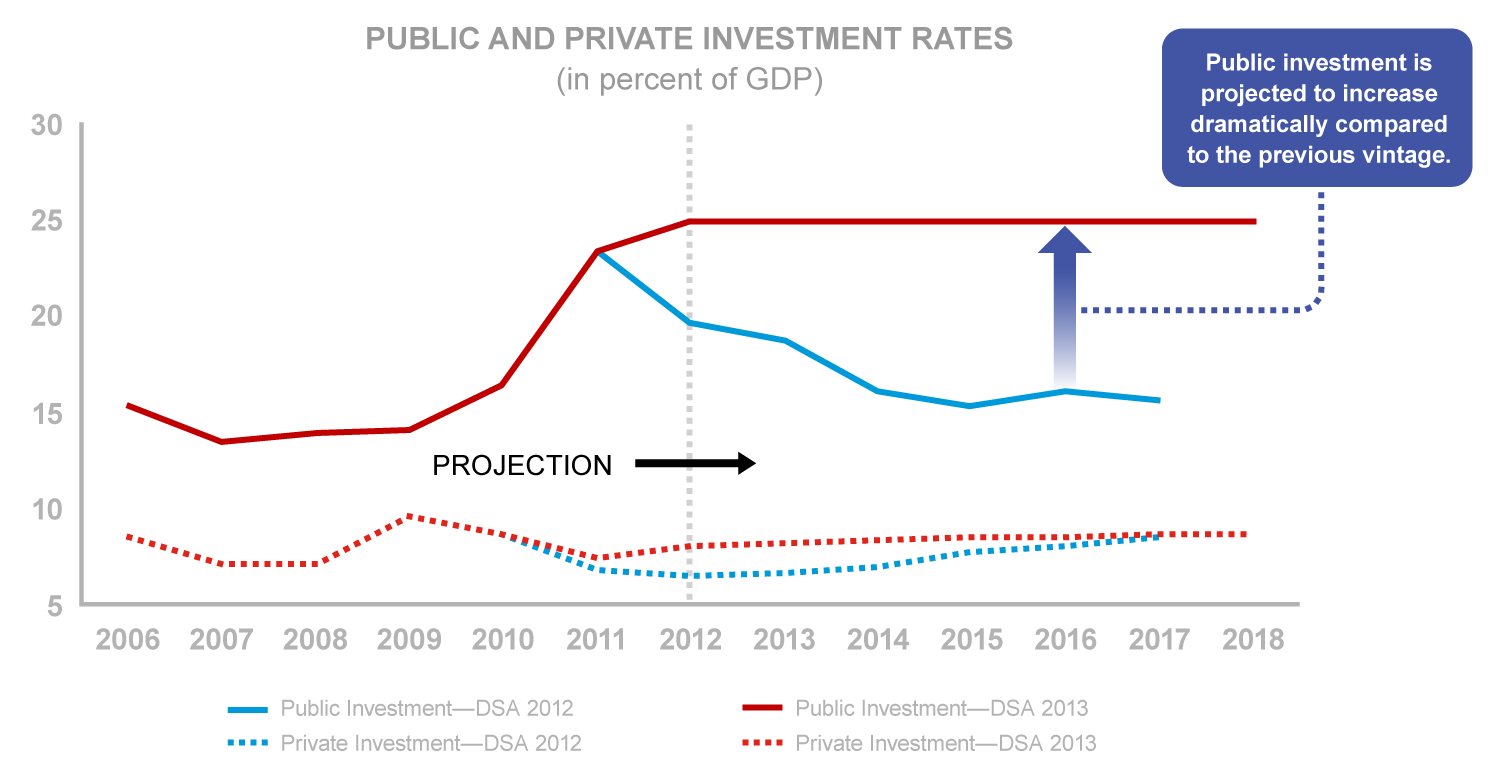
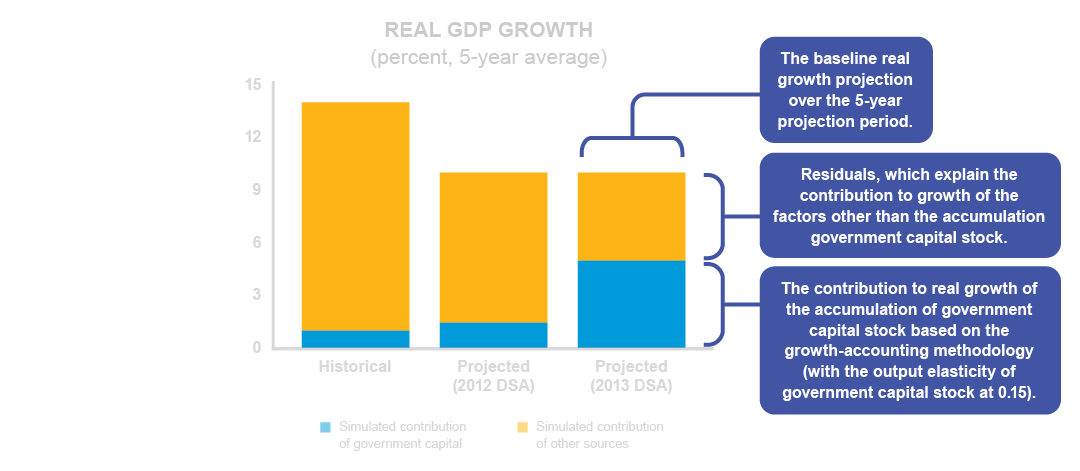
Chart 2: Contribution of Public Investment to Growth
- This tool will also alert you to any increase or decrease in public investment not associated with higher/lower growth rates. This may in turn motivate a deeper discussion regarding such results.
- The chart below shows that, based on the 2008-2012 average, public investment contributed less than 2 percentage points of real GDP growth (left-most bar).
In the example below, the contribution of government capital to overall growth is much larger than the history and the previous DSA vintage reflecting an increase in public investment. Other things equal, one would expect an increase in overall growth which is projected to be very similar to the previous vintage. Are there crowding out effects in the private sector?
Chart 2: Contribution of Public Investment to Growth
In the example below, the contribution of government capital to overall growth is much larger than the history and the previous DSA vintage reflecting an increase in public investment. Other things equal, one would expect an increase in overall growth which is projected to be very similar to the previous vintage. Are there crowding out effects in the private sector?
 Considerations
- Is there reason to believe that the improvement in efficiency of public investment is higher/lower than the LIC average, leading to a higher/lower growth response?
- Is there a reason to project an improvement in the efficiency of investment that would lead to a higher contribution to growth? For instance, because of institutional strengthening?
- Is there any reason to believe that the impact of investment on outputs will be higher/lower than the LIC average, leading to a higher/lower growth response?
- Is there any reason to project an improvement in the impact of investment on output leading to a higher contribution to growth? For instance, better prioritization of projects with strong multiplier effects?
 Takeaways for Station 3
- DSAs are only useful if the assumptions underlying them are realistic (rather than optimistic). This is why the 2017 review of the LIC DSF added the four realism tools.
- The four realism tools help examine the realism of the medium-term macroeconomic projections under the baseline scenario. They include checking the realism of the (i) drivers of debt dynamics, (ii) planned fiscal adjustment, (iii) growth and fiscal adjustment, and (iv) public investment and growth relationship.
- These realism tools are not meant to be prescriptive: every time they flag that the baseline diverges from cross-country or historical experience, a written explanation is expected to clearly discuss the underlying reasons for such divergence.
- Based on the outcomes of the realism tools' scrutiny, the baseline macroeconomic projections can and should be revisited to make them stronger and more consistent.
Travel to Station 4 for the next part of your journey
 |
 |
|
 |
 |
 |
 |
 |
 |
 |
