Image

Poverty and Shared Prosperity 2018

Piecing Together the Poverty Puzzle

Introduction

Extreme Poverty

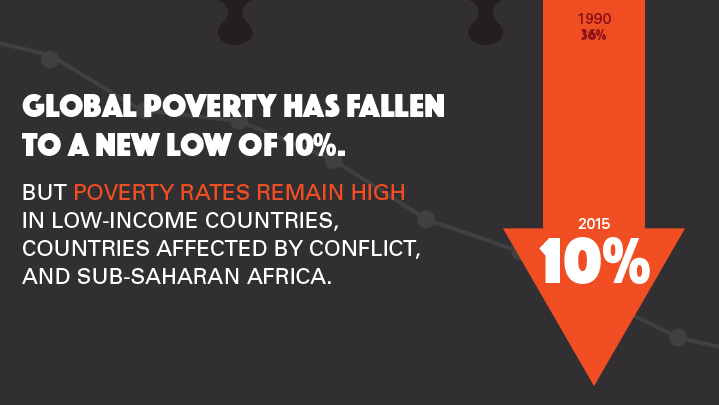
The world has made tremendous progress in reducing extreme poverty. The percentage of people living in extreme poverty globally fell to a new low of 10 percent in 2015 — the latest number available — down from 11 percent in 2013, reflecting continued but slowing progress. The number of people living on less than $1.90 a day fell during this period by 68 million to 736 million. 

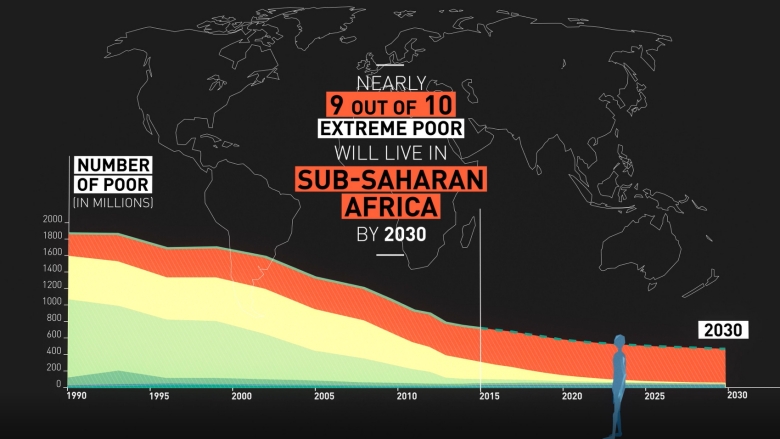
Despite the tremendous progress in reducing extreme poverty, rates remain stubbornly high in low-income countries and those affected by conflict and political upheaval. In the 25 years from 1990 to 2015, the extreme poverty rate dropped an average of a percentage point per year – from nearly 36% to 10%. But the rate dropped only one percentage point in the two years from 2013 to 2015. In fact, the total number of poor in Sub-Saharan Africa has been increasing. In 2015, more extreme poor lived in that region than in the rest of the world combined.  By 2030, under all but the most optimistic scenarios, poverty will remain in double digits in Sub-Saharan Africa.

DOWNLOAD CHAPTER

Shared Prosperity

On shared prosperity — defined as the growth in income of the bottom 40 percent in each country — the picture looks mixed. In 70 of the 91 countries for which data were available, incomes of the bottom 40 percent improved between 2010 and 2015. In addition, in 54 percent of those 91 countries, their income grew faster than the average. Progress in East and South Asia has been more impressive with the bottom 40 percent growing annually by 4.7 percent and 2.6 percent respectively from 2010 to 2015. Latin America and the Caribbean saw less growth in shared prosperity than in the recent past, but at 3.2 percent per year the bottom 40 experienced sizeable income growth. Strong income growth among the bottom 40 is also observed among various Baltic countries, as they recover from the crisis in the late 2000s. 

However, slow economic progress is hindering shared prosperity in some regions, particularly in some Europe and Central Asia which experienced negative or low levels of shared prosperity. More worrying, among poorer economies monitored in which extreme poverty rates remain high (particularly those in Sub-Saharan Africa), income growth at the bottom has on average been lower than in the rest of the world. In two-thirds of the 14 extremely poor countries, average incomes are increasing at an annual rate below the global average of 2 percent. Another worry is that data needed to assess shared prosperity is weakest in the very countries that most need it to improve. Only one in four low-income countries and four of the 35 recognized fragile and conflict-affected states have data that allows us to monitor shared prosperity over time. Since a lack of reliable data is associated with slow income growth for the poorest, the situation could be even worse than currently observed.

DOWNLOAD CHAPTER

Higher Standards for a Growing World

Higher Poverty Lines

As the world grows wealthier and extreme poverty becomes more concentrated, there are legitimate questions over whether $1.90 is too low to define whether someone is poor in all countries of the world. In half of the countries in the world, extreme poverty is at or below 3 percent, but that doesn’t mean the fight to eradicate poverty is over in these countries. The World Bank now reports on two higher-value poverty lines: $3.20 and $5.50 per day. These lines, which are typical of standards among lower- and upper-middle-income countries, respectively, are designed to complement, not replace, the $1.90 international poverty line. Data suggest that the rapid gains against extreme poverty have not been matched by reductions in the number of people living below these higher levels of income. In 2015, over a quarter of the world’s population survived on $3.20 per day and nearly half of the world still lived on less than $5.50 per day.

Societal Poverty Line

Similarly, as countries grow, their definitions of what constitute basic needs change. The cost of performing the same function may differ across countries depending on their overall level of income. To monitor this, the World Bank has introduced a societal poverty line based on the typical level of consumption or income in each country. By this yardstick, in 2015, 2.1 billion people were poor relative to their societies, three times the number of people living in extreme poverty. With over half of the population societally poor, Sub-Saharan Africa has substantially higher rates of societal poverty than other regions. In contrast, East Asia & Pacific has seen its societal poverty rate drop by 38 percentage points. Since 1990, societal poverty declined across all developing regions, but has remained stubbornly static in high-income countries.

DOWNLOAD CHAPTER

Multidimensional Poverty Measure

As we seek to end poverty, we also need to recognize that being poor is not just defined by a lack of consumption or income. Other aspects of life are critical for well-being, including education, access to basic utilities, health care, and security. The multidimensional view reveals a world in which poverty is a much broader, more entrenched problem, underlining the importance of stronger, inclusive growth and of investing more in human capital. At the global level, the share of poor according to a multidimensional definition that includes consumption, education, and access to basic utilities is approximately 50 percent higher than when relying solely on monetary poverty. 

In a sample of 119 countries for the years around 2013, only one in eight are poor in monetary terms, but among them eight out of nine are also deprived in at least one other dimension, lacking education or basic infrastructure services. In Middle East & North Africa and Latin America & the Caribbean, despite the low prevalence of monetary poverty, almost one in seven people lack adequate sanitation. In Sub-Saharan Africa, more than in any other region, shortfalls in one dimension go hand-in-hand with other deficiencies. Even though South Asia has made progress in poverty reduction, shortfalls in education remain high for both adults and children and aren’t strongly associated with monetary poverty. In addition, the number of people in the region living in households without access to electricity is far greater than those living in monetary poverty.

DOWNLOAD CHAPTER

Inside the Household

People experience poverty differently even within the same household. Traditional measures haven’t been able to capture variations because the surveys stop at the household level. Measuring poverty as experienced by individuals requires considering how resources are shared among family members. While data are limited, there is evidence that women and children are disproportionately affected by poverty in many — but not all — countries.  Sex differences in poverty are largest during the reproductive years, when, because of social norms, women face strong trade-offs between reproductive care and domestic responsibilities on the one hand and income-earning activities on the other hand. Worldwide, 104 women live in poor households for every 100 men. However, in South Asia, 109 women live in poor households for every 100 men. Children are twice as likely as adults to live in poor households. This primarily reflects the fact that the poor tend to live in large households with more children. 

There is evidence from studies in several countries that resources are not shared equally within poor households, especially when it comes to more prized consumption items. There is also evidence of complex dynamics at work within households that go beyond gender and age divides. More surveys are needed to capture consumption patterns of individuals so that governments can implement policies to bridge the inequalities within households. 

DOWNLOAD CHAPTER

Data Visualization

Contact Us

Connect Us

The World Bank Group

1818 H Street, N.W. Washington, DC 20433 USA

Questions ? Send us an email


Back to Top