publication

Water Supply, Sanitation, and Hygiene (WASH) Poverty Diagnostic Initiative


Introduction

Who are the poor people in a country and where do they live?  What is their level of access to quality Water Supply, Sanitation, and Hygiene (WASH) services?  What are the linkages of inadequate WASH services with health and nutrition?  And what are the binding constraints to improving service delivery? 

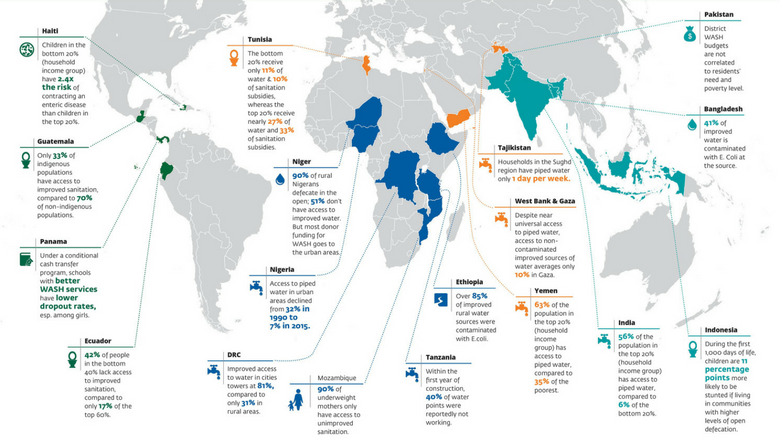
These are the four key questions that a new World Bank initiative set out to answer.  This initiative, the Water Supply, Sanitation, and Hygiene (WASH) Poverty Diagnostic, encompasses 18 countries, ranging from fragile and conflict-affected states to middle-income countries.

Over the past three years, it has assessed the relationship of poverty, time, physical space and social space with drinking water, sanitation and hygiene, as well as the knock-on effects on a person’s life cycle. It was not designed just to answer the “What?” but to also look at the “So What?” and “Now What?”  After all, water is life.  And that is both a very simple and very complex relationship.

To better understand this relationship, this initiative undertook multidisciplinary research - developing in­novative methods to fully appreciate the impacts of inadequate services on human development outcomes and identify the binding constraints to service delivery. Supported by the Swedish International Development Cooperation Agency (SIDA), the initiative is a large-scale partnership between the World Bank’s Water, Poverty, Governance, Health, Nutrition & Population teams and these countries. This work is especially relevant for the SDG era and as countries look to harness their precious WASH resources for maximum impact.  


Global Findings

At the global level, the WASH Poverty Diagnostic Initiative recommended three ways of thinking and working differently to ensure safe and sustainable water and sanitation for all.

View the Full Infographic

Image

·         In Guatemala, Niger, the Democratic Republic of Congo, Mozambique, Yemen, and Bangladesh, the rate of stunting among children under 5 is over 30 percent. Stunting is a powerful risk factor associated with 53 percent of deaths related to infectious diseases in developing countries.

·         In Bangladesh, children that drink E. coli-contaminated water are at higher risk of stunting than those who are not exposed to such water.

·         WASH, coordinated with other health interventions, can have greater effects on reducing stunting than the sum of only providing adequate WASH services and only providing adequate health services.   

Image

·         In Niger, most of WASH investments go to the urban water sector, leaving 90 percent of the rural population without a toilet and 51 percent without access to improved water.

·         In Nigeria, 30 percent of the water points stopped working in the first two years.

·         WASH investments will have the greatest impact on childhood mortality due to diarrheal disease when they target geographic areas where populations have little access to WASH services and have other vulnerabilities.

Image

·         In Mozambique, provincial and district-level budgetary allocations are not based on transparent criteria and are subject to change during the budget discussions at the national level. 

·         In the West Bank, local governments have control over political and administrative functions, but not fiscal authority. In the absence of stable fiscal transfer, they rely on their own revenues from electricity and water to finance their operating budgets.

·         In Tanzania, the water budget quadrupled between 2002­ and 2014. But as of 2015, access to basic water services had stagnated at just over 50 percent of the population.


Country Analyses 

Offering a comprehensive analysis of water and sanitation indicators, the initiative spans 18 countries around the world and, for the first time, pinpoints specific geographic regions within countries that have inadequate WASH services.  It sheds light on major disparities in water supply and sanitation services between rural and urban, poor and non-poor areas. 

Click the links below to download in-depth analysis on each country (more will be available on this page soon).

LAC

MENA

ECA

AFR

SAR

EAP

Take a look at the key facts by country below and download a full spread map with these key facts here

Image

Additional Data

  1. Bangladesh Urban Informal Settlements Survey 2016
  2. Bangladesh Poverty and Groundwater Salinity Survey 2016
  3. Infographic: Unlocking Service Delivery for Water Supply Sanitation and Hygiene (WASH) in Liberia.


Last Updated: Feb 07, 2019


Welcome